Singapore and its Pursuit of GDP Growth
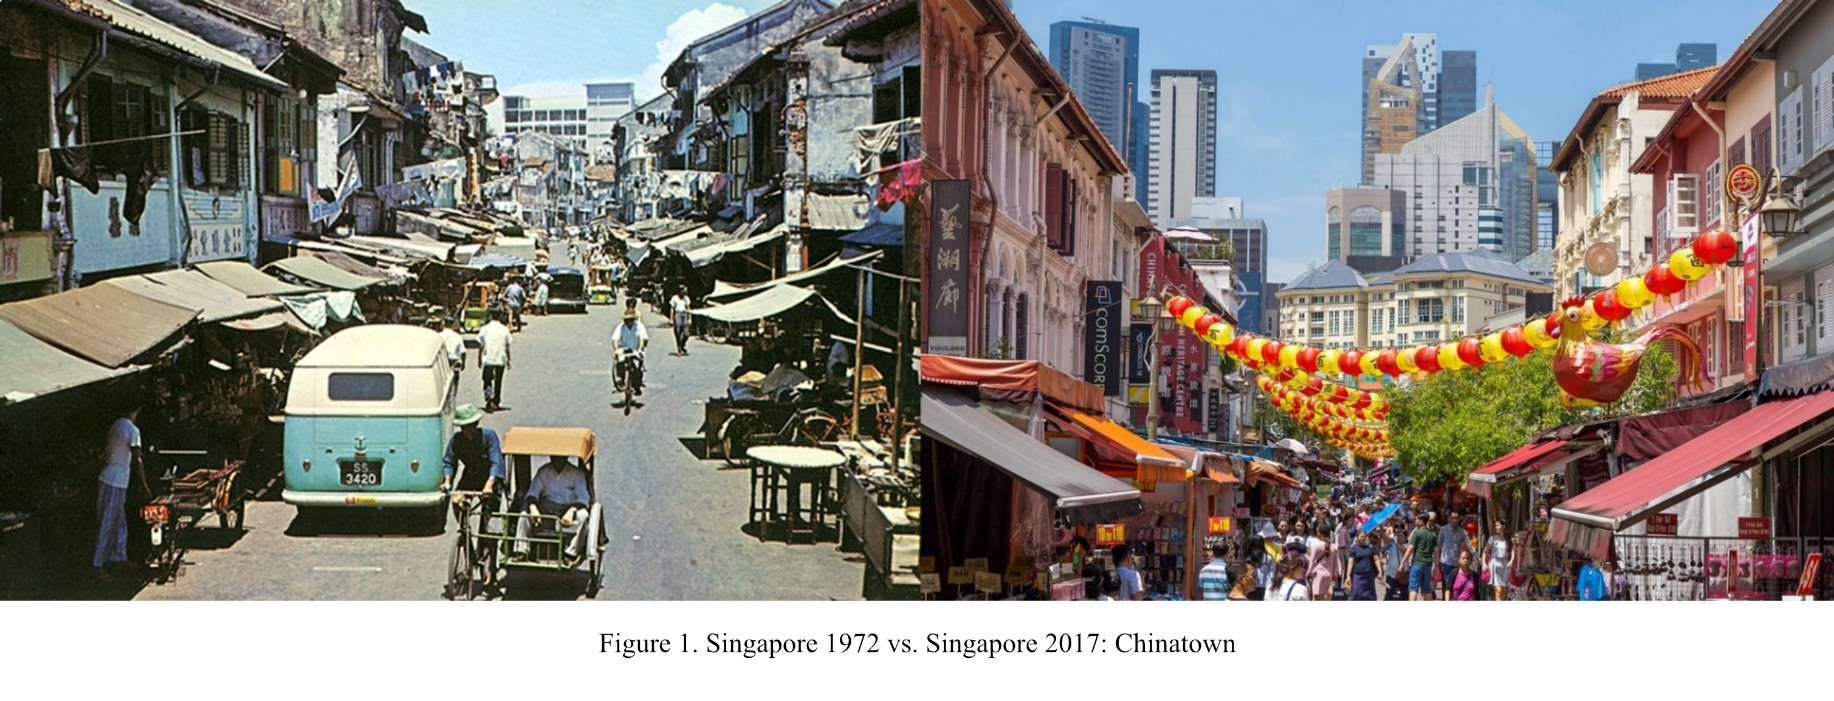
Left: A scene in Chinatown in the 1970s. Postcard. Striderv. Retrieved from: https://www.flickr.com/photos/striderv/2981137997/in/album-72157608449483592/ (Accessed: 30.10.2020). Right: Chinatown Singapore in 2017. Marco Verch under Creative Commons 2.0. Retrieved from: https://foto.wuestenigel.com/chinatown-singapore/?utm_source=35995044141&utm_campaign=FlickrDescription&utm_medium=link (Accessed: 30.10.2020).
Main Theme
Gross domestic product growth was of primary importance in Singapore. Since its independence in 1965, the southeast Asian city-state’s government fixated on GDP figures and managed a shift from a Third World to a First World country with one of the highest GDP (US$ 372.1 Billion) and GDP per capita (US$ 65,233) in today’s world (World Bank 2019). Singapore’s ascent was driven by FDIs and an influx of foreign workers and businesses while relying on an export-oriented development strategy.
State of Research
Singapore’s accelerating economic growth has been intriguing international and Singaporean researchers alike. There is an abundance of literature examining and explaining Singapore’s rapidly increasing GDP growth in the 1970s, 80s, and 90s. For example, Huff (1987, 1995), LePoer (1991), Chong-Yah (1986), and Peeble (1996) researched the city-state’s first period of growth and thoroughly discuss the factors playing into Singapore’s economic development before the turn of the new millennium.
Current research has been focusing on the second period of growth, from the 2000s to today, identifying newly arising problems in Singapore. Poverty, inequality, social welfare, and declining labor productivity were studied by Ng (2015), Rahim (2015), and Mahadevan (2009). More literature, such as Song and Bhaskaran (2015), has explored the government’s role in Singapore’s rise to being one of the richest countries in the world thanks to both periods of growth.
Sources
Data from the Department of Statistics Singapore, the World Bank, and the UN Comtrade Database are used to delineate Singapore’s path to rapid economic growth and to investigate the representativeness of different indicators of Singapore’s economic ascent, such as GDP, GDP per capita, and gross national income (GNI).
Singapore is confident regarding its growth numbers. The government and its citizens are proud of the country’s economic success, and the authorities put great effort into presenting the economy’s data on the website of the Department of Statistics Singapore. However, data on inequality and poverty in Singapore should be approached with caution as the city-state does not apply international standards and, at times, does not gather certain information. Nevertheless, overall, Singapore’s numbers can be considered trustworthy, but it is important to keep in mind that not all indicators receive the same attention from the Singaporean Government.
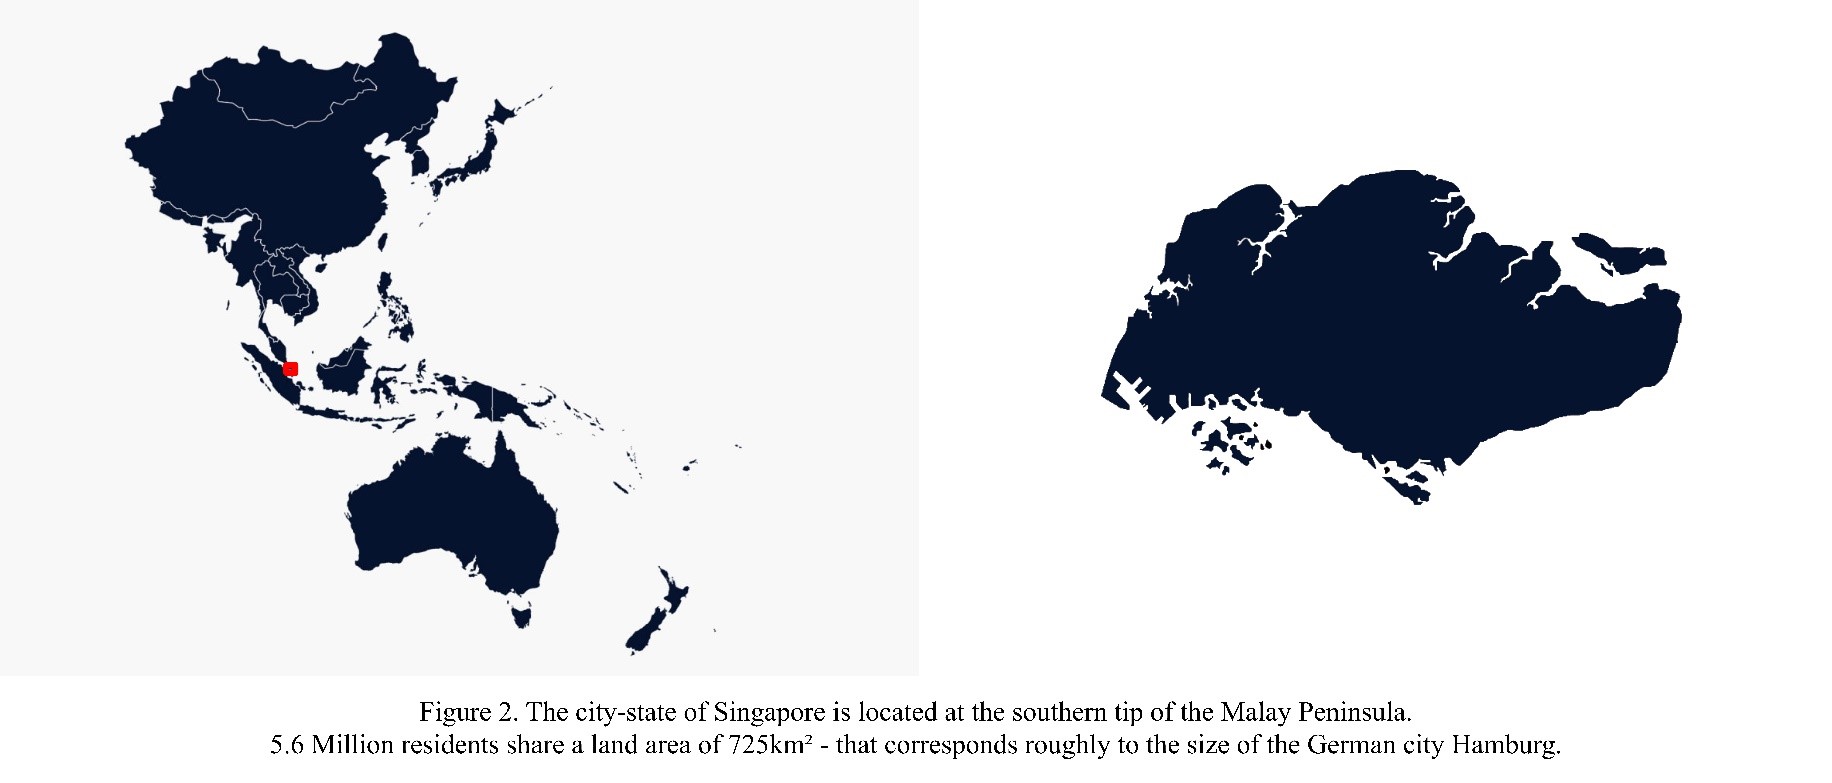
Left: Map of Asia Pacific, Vector. Retrieved from: https://www.c-store.com.au/australia-takes-the-lead/map-of-asia-pacific/ (Accessed: 30.10.2020). Right: Silhouette of Singapore, Vector. Retrieved from: https://pngio.com/PNG/a132419-singapore-map-png.html (Accessed: 30.10.2020).
Singapore
Singapore is a sovereign city-state in the southernmost part of the Malay Peninsula. It used to be a British colony and was later part of the Malaysian Federation. Since 1965, Singapore has been an independent state and has its own currency, the Singapore dollar. In many ways, the island state is exceptional. Singapore is a cultural melting pot, bringing various ethnicities and religions together. The resident population comprises 74.3% ethnic Chinese, 13.4% ethnic Malays, 9.0% ethnic Indians, and 3.4% others, consisting of ex-pats or guest workers from countries from all around the world (Department of Statistics Singapore 2018). Singapore has four official languages: English, Mandarin, Malay, and Tamil. Moreover, despite its small land size of 725km², its airport and shipping port are some of the busiest worldwide. Singapore is governed by the People’s Action Party (PAP), which has held a majority ever since the country became independent. The party played a crucial role in the history of Singapore’s path to economic growth as it strongly focused on GDP figures and, specifically, pursued its expansion.
GDP Bonus
The term “GDP Bonus” describes the remuneration of ministers and members of the Singaporean Parliament according to the GDP growth they generated. This system was implemented to create an incentive for government officials to encourage policies that would specifically stimulate an increase in the GDP. The existence of this remuneration reflects that GDP growth played a superordinate role in Singapore’s economic development strategy.
In 2012, however, the “GDP Bonus” was converted into the “National Bonus,” replacing GDP as the only link to the socio-economic outcome of Singaporeans. According to the Public Service Division Singapore (2012), more indicators, such as the real median income growth rate of the average Singaporean, the real income growth rate of the lowest 20th percentile of Singaporean income earners, and the unemployment rate of Singaporeans, have been added as determinants of the bonus.
Owing to this long-term pursuit, Singapore is today considered a paragon of GDP and GDP per capita growth. The following graphs reveal that Singapore’s past ambitions have been largely realized.
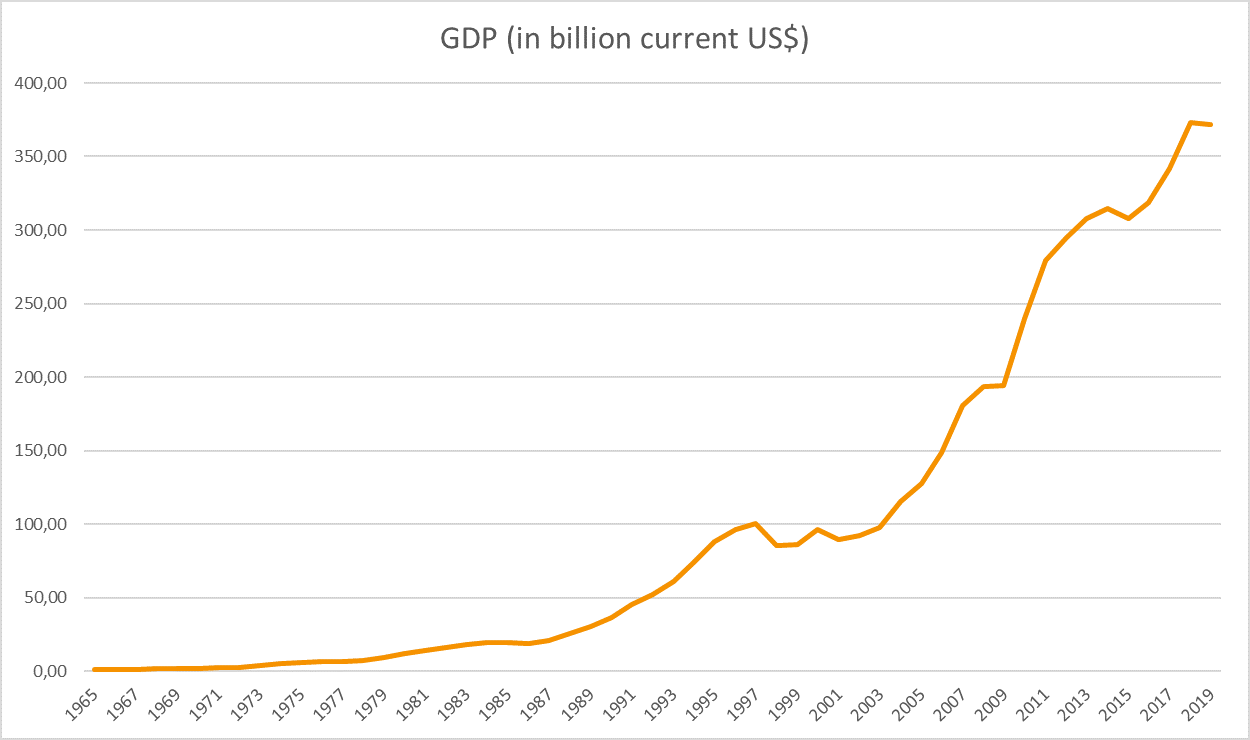
Data: World Bank
Over the years, GDP and GDP per capita accelerated. Graphs 1 and 2 illustrate a huge leap in GDP and GDP per capita growth. The data for Graph1 are provided by the World Bank, given in current US dollars, whereas the data for Graph 2 are from the Department of Statistics Singapore, given in US dollars as well. In 1965, GDP per capita started at US$ 516. It is important to note that when Singapore began its path as an independent country, it was already in a more favorable position than the surrounding countries. For example, Malaysia’s GDP per capita for the same year was US$ 310, and Indonesia’s GDP per capita was US$ 53 in 1967 (World Bank 2020). The reason for Singapore’s comparably high GDP and GDP per capita was its affiliation to the British Empire as a former colony. In the 1960s, Singapore was an already established trading hub with a “convertible currency based on the British pound sterling, with a British legal system” (Ng 2015, p.2) and an elaborate transport and trading infrastructure. Building up from there, the city-state experienced steady growth before stagnating in the 1990s. After the turn of the millennium, however, GDP per capita continued to grow at high rates and hit a peak of US$ 66,174 in 2018. Both graphs reveal how quickly Singapore generated GDP and GDP per capita growth. Singapore caught up with the Western developed world within 50 years. The GDP per capita of Singapore and the US were level in 2019: US$ 65,233 for Singapore, and US$ 65,118 for the US (World Bank 2020). There seems, however, to have been various phases of growth during the development of Singapore’s GDP. Graph 1 displays slower economic growth from 1965 to the mid-1990s and a boom after the turn of the millennium.
Construction of Gross Domestic Product
Gross domestic product is a political category and should always be critically assessed. Countries worldwide use different definitions and different methods, and they may also have different standards in reporting – depending on resources, training, and budget. Singapore’s statistical authority, the Department of Statistics, has existed since the 1950s and initially focused on trade, shipping, and basic demographic data, since entrepot trade and port operations were predominant in the economy. Statistical coverage expanded in the 1960s to include manufacturing, commerce, and services (Department of Statistics 2019). Only in 1973 did Singapore adopt a decentralized statistical system. The main approach to compiling GDP in Singapore is the output approach. To compile data, Singapore uses the Singapore Standard Industrial Classification (SSIC), which provides a framework for the classification of its economic activities. The SSIC was implemented in 2015, and this is used for compiling data by the Singaporean Department of Statistics, from which the data used for the graphs in this text were taken. In contrast, for example, the World Bank focuses on consistency with international guidelines, and may make adjustments when discrepancies occur. This approach can lead to differences when obtaining data from national authorities and the World Bank. The graphs, below, illustrate estimates for the same indicators from those two institutions for Singapore.
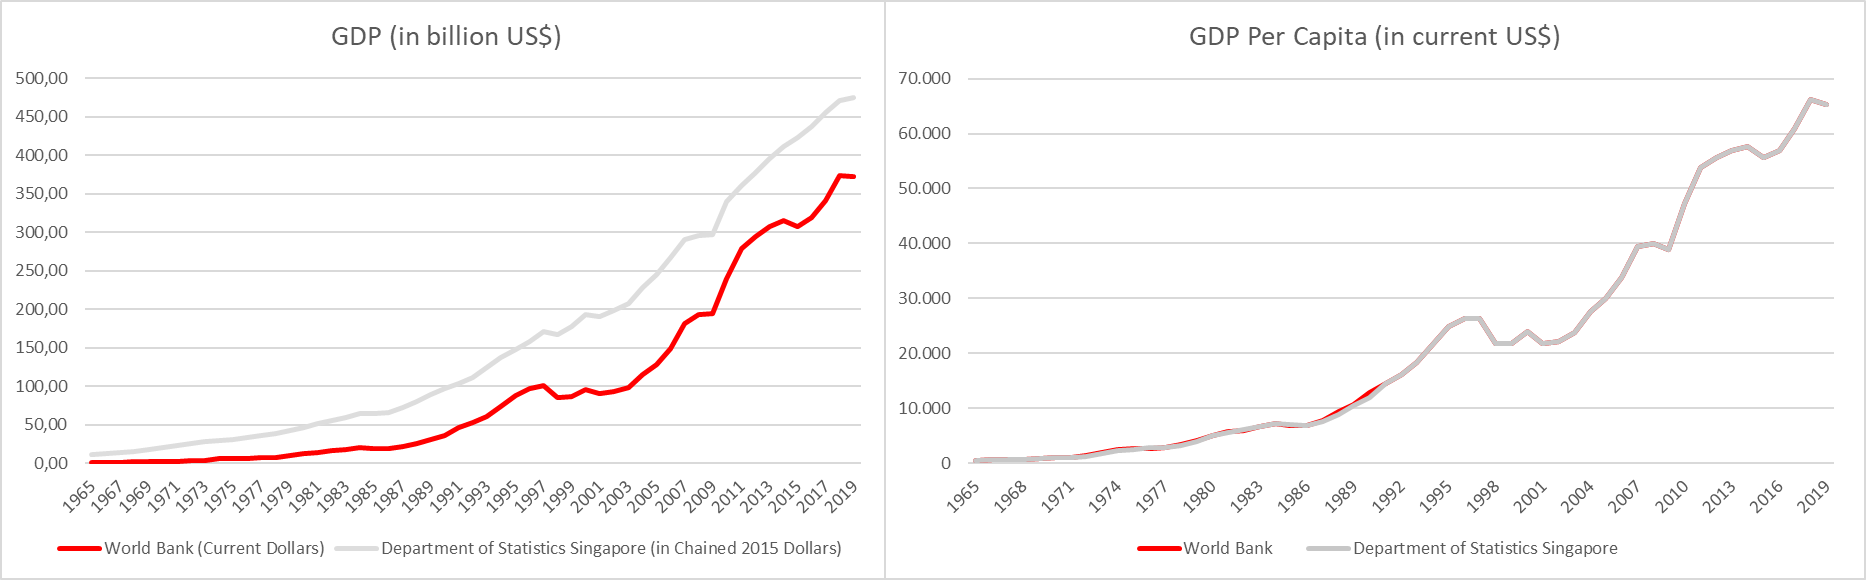
Data: World Bank
Depending on the method of measurement, the size of indicators may vary. For example, Singapore’s GDP in the left graph is given in chained 2015 dollars, which causes the difference between the Singaporean statistics and the World Bank statistics when calculating the GDP. However, the GDP per capita, measured in current US$, indicates no remarkable differences. Moreover, it may be relevant that the World Bank applies international guidelines, which leads to marginal differences. During the course of this article, it is made clear that Singapore may not apply to international standards when collecting data at all times.
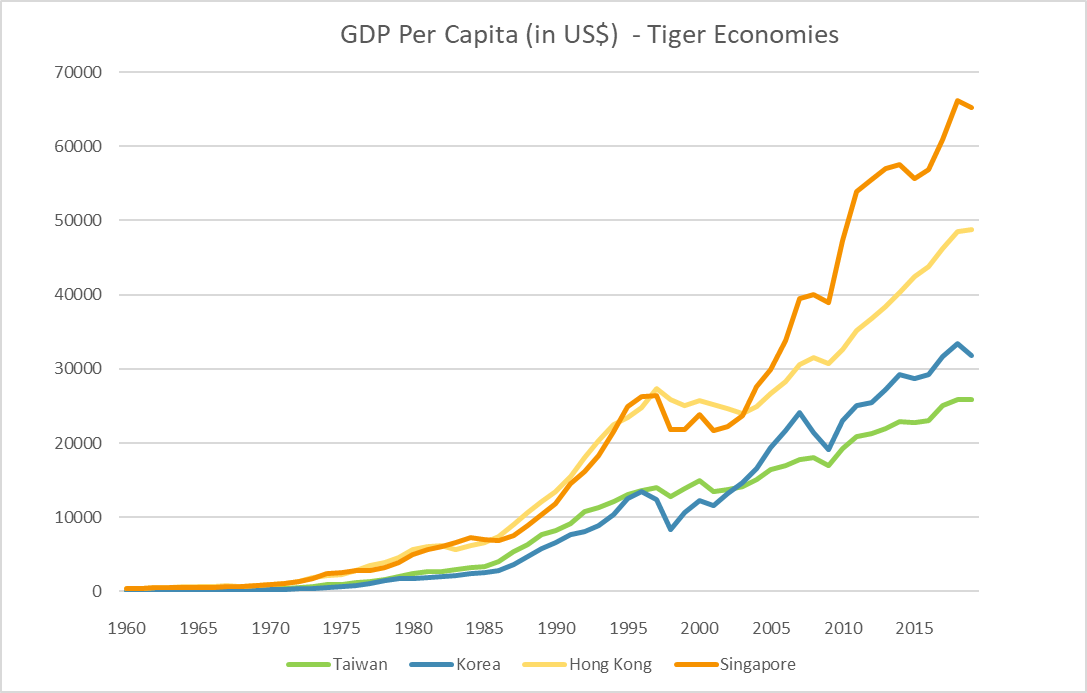
The Asian Tigers
Singapore’s rapid economic development is not unique in history. Taiwan, South Korea, and Hong Kong have all had similar experiences regarding their GDP per capita growth in the past five decades, as outlined in Graph 3. Due to their economic leap, these states are referred to as “Tiger Economies” or “Newly Industrializing Countries” (NICs; Chowdhury & Islam 1993, p.1). A common feature in the developments (Graph 4) is recession because of the Asian Financial Crisis of 1997–98, which led to a decrease in GDP per capita in all four NICs.
Singapore experienced the highest GDP per capita growth among its competitors. The graph utilizes data from the World Bank to illustrate the GDP per capita growth for Hong Kong, Singapore, and South Korea. Since Taiwan is not internationally recognized as independent from China, there are no separate GDP data for the island provided by the World Bank. Therefore, data were taken from the National Statistics for the Republic of China (Taiwan) and included in the graph to provide a complete picture of the development of all four Asian NICs.
Data: World Bank
Although these four countries have experienced similar trends in GDP per capita growth, they have reached different levels. For example, Taiwan, with a GDP per capita of US$ 25,893, and South Korea with a GDP per capita of US$31,761, reached roughly only half of Singapore’s US$ 65,233 GDP per capita within the same period.
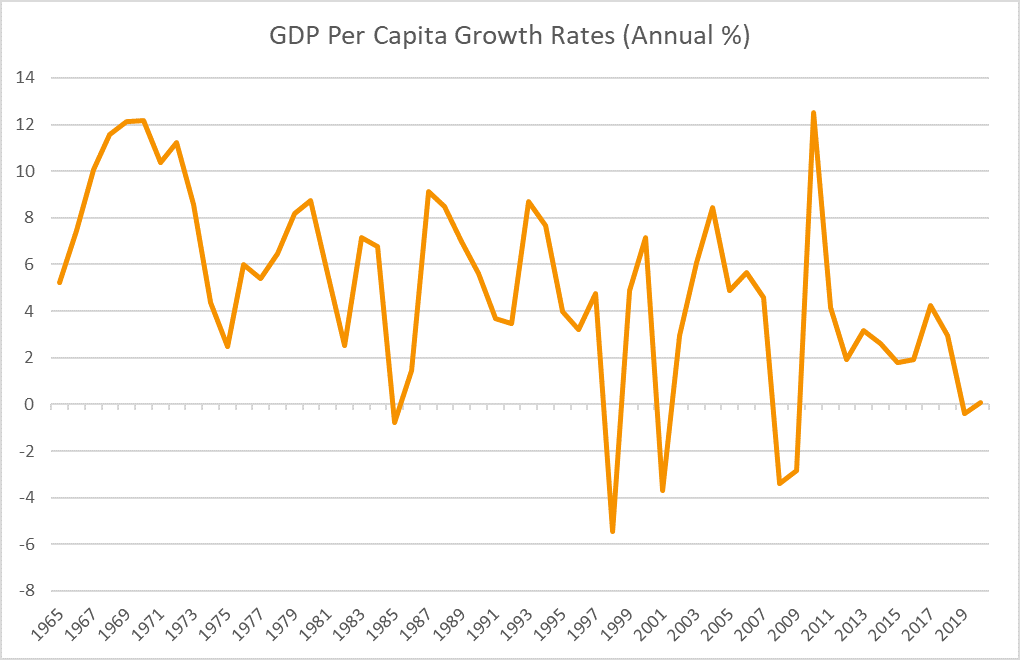
Singapore’s economic success is exemplary. However, that does not mean that Singapore has not faced challenges. Its economy has always been fairly dependent on world developments and followed the economic fluctuations of the countries it has been trading with. The GDP per capita growth rates may offer a clearer picture of Singapore’s experience on the path to economic growth.
Data: World Bank
Graph 5 refers to the years 1965 to 2019, presenting the annual GDP per capita growth rates in percentages. It is obvious that GDP per capita growth has not been as stable as Graphs 1 and 2 suggest. Graph 4 reveals fluctuations in GDP per capita growth due to Singapore’s export-oriented economy and the resulting dependence on the global market. The illustrated fluctuations are indicators of booms and recessions in the country’s economy. In the case of Singapore, those business cycles have been moving synchronously to crises affecting the world market. After a rapid increase in GDP per capita in the 1960s, the 1973–74 oil crisis delivered a blow to the city-state's first GDP per capita upswing. Growth rates did recover but plummeted once again due to the 1985 recession. Singapore managed to stimulate almost 10% GDP per capita growth rates shortly after. The 1997–98 Asian Financial Crisis affected Singapore especially hard and caused a 6% decrease in GDP per capita growth rates. Just a few years later, the SARS outbreak in 2002 inflicted a heavy toll on Singaporean businesses as tourism and transport-related industries, for example, hotels and airlines, were affected by the decline of visitor arrivals (Asia-Pacific Economic Cooperation 2004, p.672). The last recession was the Global Economic Crisis of 2008–09, which generated negative growth rates once again. As Singapore has always been deeply connected to the world market and highly dependent on exports to countries such as Japan, the US, and Europe, the global economic recession led to decreased demand for Singapore’s exports and impacted its financial sector, which has become increasingly important as the government adjusted the city-state’s economic structure (Jordan 2009).
What is remarkable is that Singapore took those recessions but recovered quickly and always managed to bring its GDP per capita growth rates back on track. Despite the strong volatility Singapore has been exposed to, it ranks as one of the richest countries in the world, at least when considering the economic indicators of GDP and GDP per capita.
How did Singapore obtain its extraordinary position and stimulate rapid GDP and GDP per capita growth?
Singapore’s past interventionist macroeconomic policies occupy center stage when answering this question. Its government explicitly focused on GDP and undertook systematic macroeconomic actions to incite its growth. Over time, officials have applied different strategies to catalyze GDP growth. The subsequent economic progress and sectoral change the economy experienced can be divided into two broad periods of growth, which are now examined.
Periods of Economic Growth: 1965 to the 1990s – From a Trading Hub to an Industrialized Country
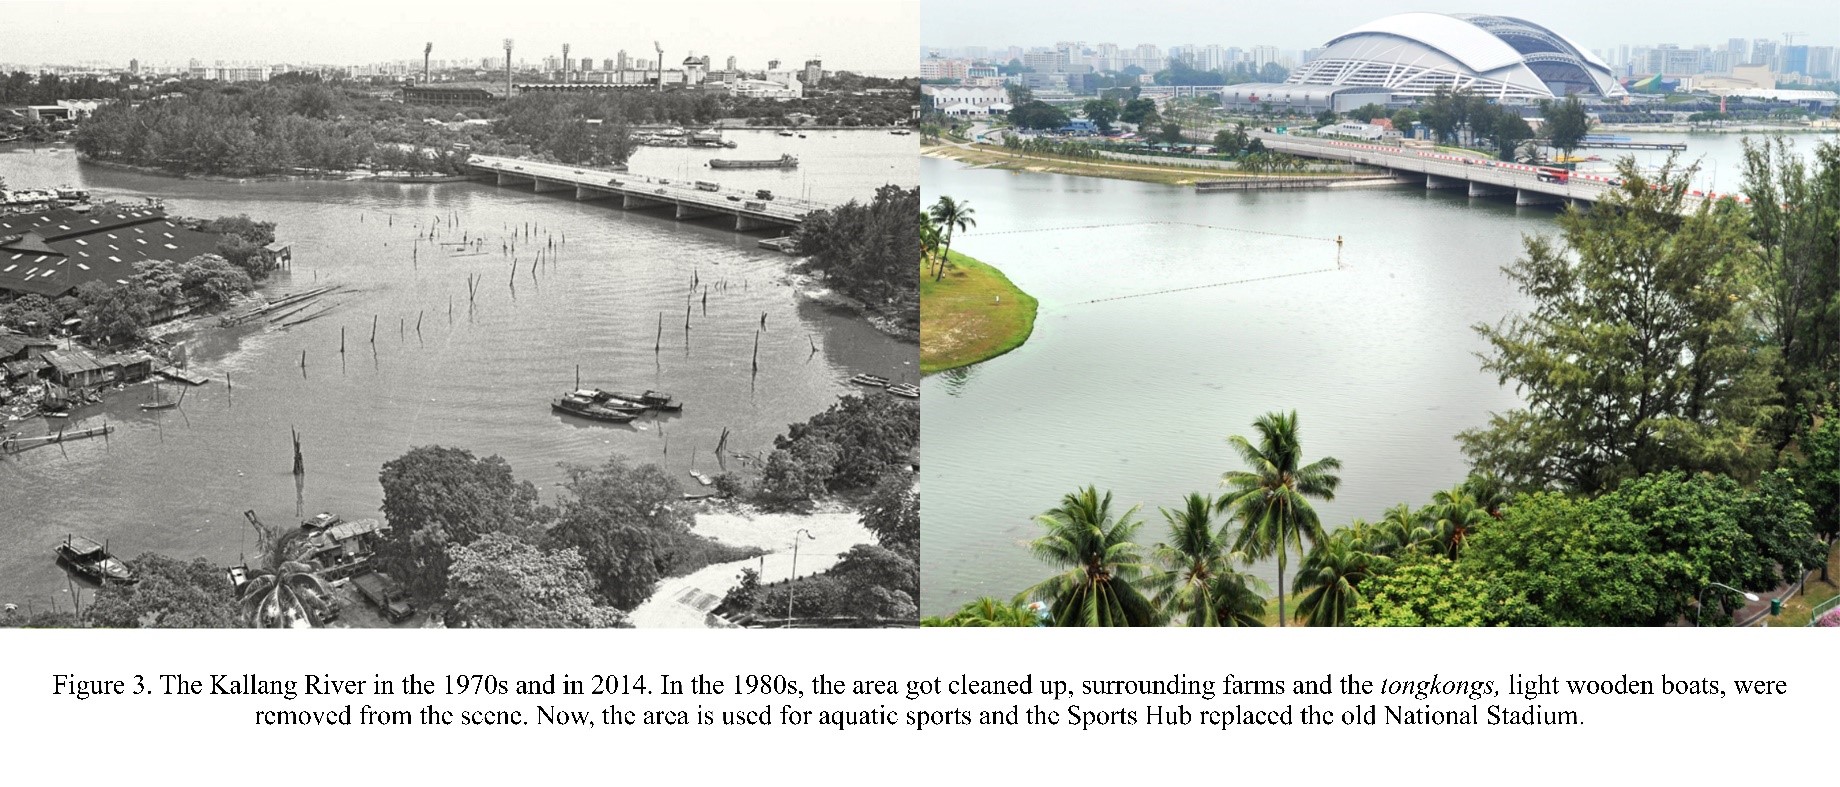
Left and Right: Photographs of the Kallang River in Singapore in the 1970s and 2014. The Straits Times. Retrieved from: https://discoversg.com/2016/06/08/look-far-singapore-come-compare-now-then/ (Accessed: 30.10.2020).
When Singapore became independent in 1965, the island was an already established trading hub. However, the former British colony had little infrastructure, widespread unemployment, and low education levels. A key question for policymakers was how to overcome the constraint of the country’s size and “expand its economic space” (Song & Bhaskaran 2015, p.9). Foreign direct investments were considered the main driver of economic growth in the first three decades after Singapore’s independence (Siow-Yue 1986). Furthermore, the expansion of employment and the skill-upgrading of Singaporean citizens was crucial for building a basis for further growth.
A non-economic factor essential for Singapore’s development during that period was social stability. Racial riots between the Malay and Chinese populations in 1964 and 1965 sowed mistrust, which had to be addressed. Ever since, racial harmony has been a promoted concept to secure peace between the various ethnicities and religions. Lee Kuan Yew (2009, p.120) considered multicultural tolerance a “social precondition” for Singapore’s economic success. Furthermore, the former prime minister stressed the importance of the invention of air conditioning to public efficiency in Singapore’s humid climate (Lee Kuan Yew 2009). However, there have been no qualitative or quantitative studies regarding this aspect, which makes this narrative, hitherto, an urban legend.
Foreign Direct Investments
Foreign direct investments were the main factors helping Singapore to upgrade from a trading hub to an industrialized country with manufacturing industries. Up until the point of self-government, Singapore had been mainly dealing with raw materials, and therefore had little experience with manufacturing industries, unlike, for example, Hong Kong. The reason Singapore had been supporting foreign investment was to promote industrialization (Siow-Yue 1986). Policies regarding foreign investment were very liberal, a “unique feature [was] the general absence of restrictions and regulations governing both the entry and operation of foreign enterprises and foreign personnel” (Siow-Yue 1986, p.81).
Due to its favorable investment climate, Singapore was successful in attracting FDIs. Moreover, its strategically advantageous location and commercial connectedness to other countries as a former British colony amplified the progress. In addition, Singapore has kept English as its official language, which helped it to become and remain globally competitive as this facilitated trade and business.
Investments in Human Capital
Ultimately, the adaption to manufacturing industries had to be carried by the workforce. Therefore, investments in human capital, education, and job training were equally important, which is why the government set up a system to foster education and housing. However, FDIs significantly contributed to investments in human capital and were the solution to Singapore’s unemployment problem, “so much that the city-state has been experiencing labor shortages” (Siow-Yue 1986, p.112) already in the 1980s. Singapore, therefore, started to depend increasingly on imported labor.
In this first phase of growth, Singapore’s government built up a base for the growth yet to come. It successfully performed a shift to an industrialized economy and established a manufacturing sector that is, even today, the “backbone of the economy” (Jordan 2009, p. 96).
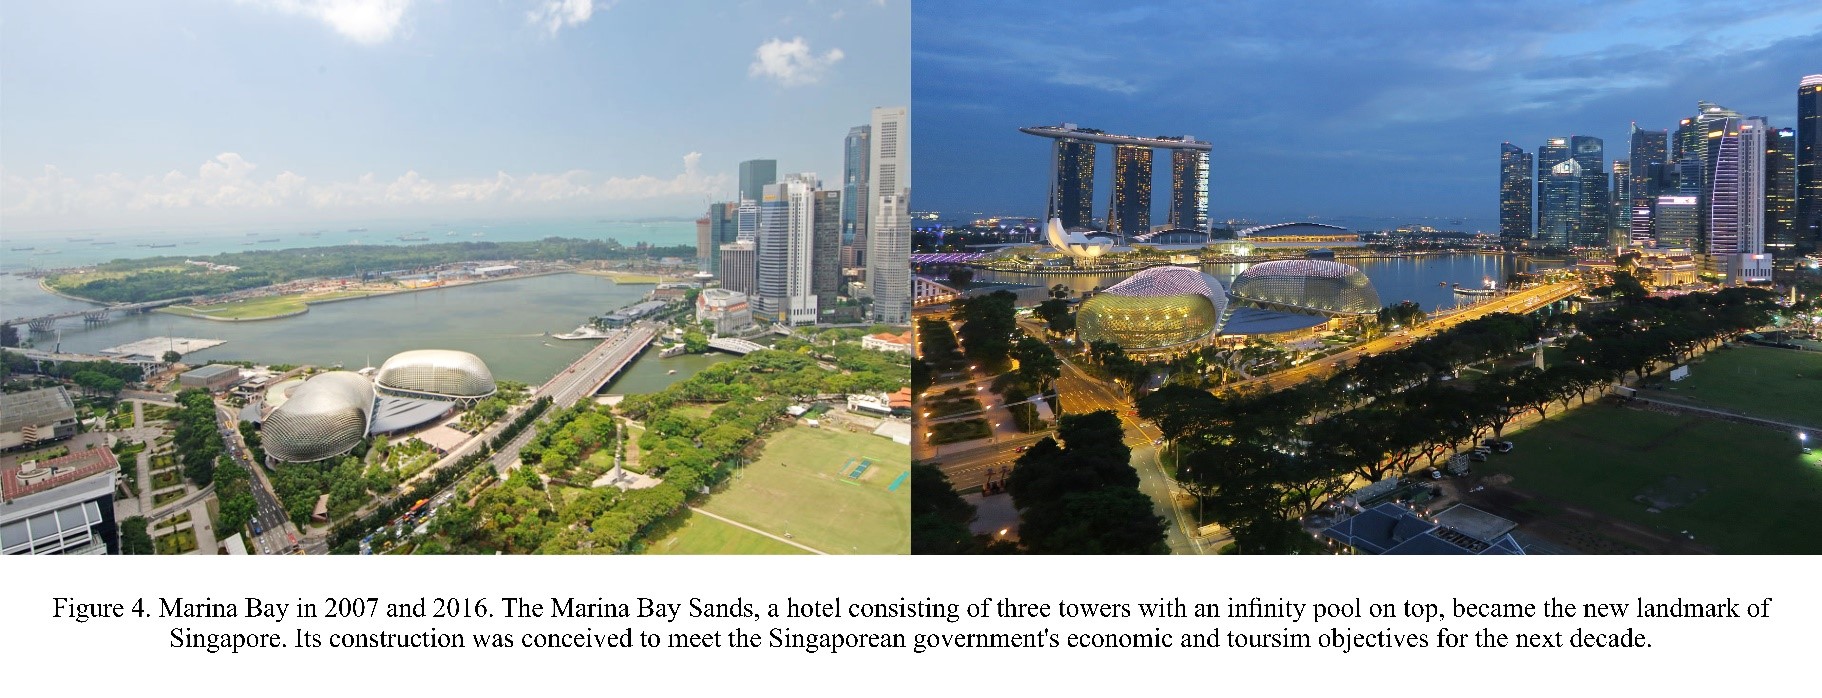
Left: View of Marina Bay in 2007. Urban Redevelopment Authority. Retrieved from: https://graphics.wsj.com/documents/wsj_sliders/?standalone=1&s=SMARINA1001 (Accessed: 30.10.2020). Right: View of Marina Bay and the Marina Bay Sands Hotel in 2016. Adam Hill. URL: https://pixabay.com/de/photos/stadt-skyline-architektur-stadtbild-3339933/ (Accessed: 30.10.2020).
As part of its new growth strategy, Singapore facilitated the influx of the desired “foreign talent.” The government liberalized immigration and foreign-worker policies, targeting professionals, entrepreneurs, and students. A new employment pass, the “S-Pass,” was introduced to speed up the inflow of foreign workers. Between 2004 and 2014, the size of the non-resident workforce increased by 121% (Song & Bhaskaran 2015, p.18). Singapore’s desired target group was high-skilled workers; however, many low-skilled workers also entered the country. Nevertheless, Singapore did not restrict the inflow, as more residents meant a higher GDP growth that government officials did not want to miss, which again stresses the government’s pursuit of GDP growth (Song & Bhaskaran 2015, p.20). In 2000, Singapore counted a total population of 4,027,887, which increased to 5,685,807 in 2020 (Department of Statistics Singapore 2020). The immigration of foreigners had a positive effect on the economy and increased the GDP, but, at the same time, it is the reason for new and severe challenges for the small city-state.
Low Corporate Tax
Singapore’s strategy to fuel innovation and attract foreign talent to stimulate more GDP growth included reducing corporate tax. Since 2010, corporate income has been taxed at 17% (Inland Revenue Authority of Singapore 2020). Singapore already offered tax exemptions and tax holidays to selected enterprises in the 1960s and 1970s (Siow-Yue 1986); however, the tax of 17% is, compared with international standards, very low and can be reduced even further if companies adopt further schemes offered by the Inland Revenue Authority of Singapore. By implementing this system, Singapore became attractive for international companies and firms. Today, the city-state is considered a “tax haven” and an attractive entry point for companies that want to break into the Asian market.
Free Trade Agreements
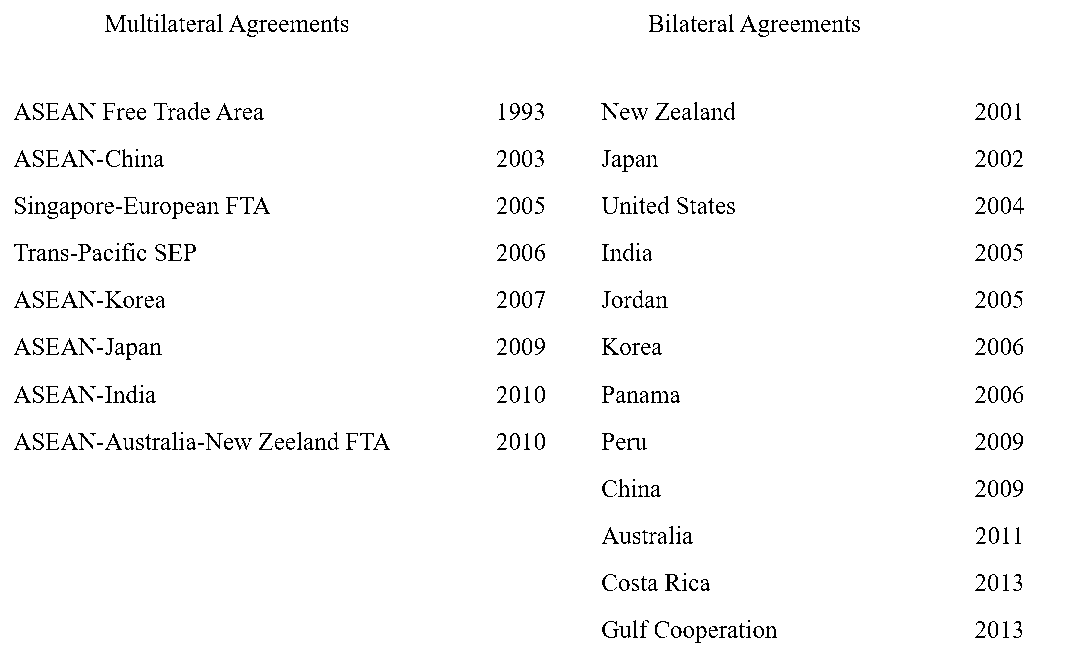
Parallel to these internal measurements, Singapore expanded its economic space by establishing a trading network with other countries. Singapore has been one of the main supporters of the Association of Southeast Asian Nations (ASEAN), which promotes better relations between its member countries, regional peace and stability, and economic growth and development. Since the 2000s, there has been an obvious increase in the number of free trade agreements (FTAs) between Singapore, the ASEAN, and other economies. The idea behind diversifying the composition of export and import markets was to help Singapore manage and balance out “fluctuations in global and regional demand” (Song & Bhaskaran 2015, p.9)
Trade Agreements Database, World Trade Organization

Data: UN Comtrade Database (2020)
Singapore’s GDP growth took off after the turn of the millennium because the government facilitated an influx of foreign workers and foreign businesses and successfully expanded its economic space by setting up diplomatic relations and trade agreements to strengthen exports. This text now discusses how these policies and the objectives of the structural change and expansion of economic space are expressed in the data.
Sectoral Change
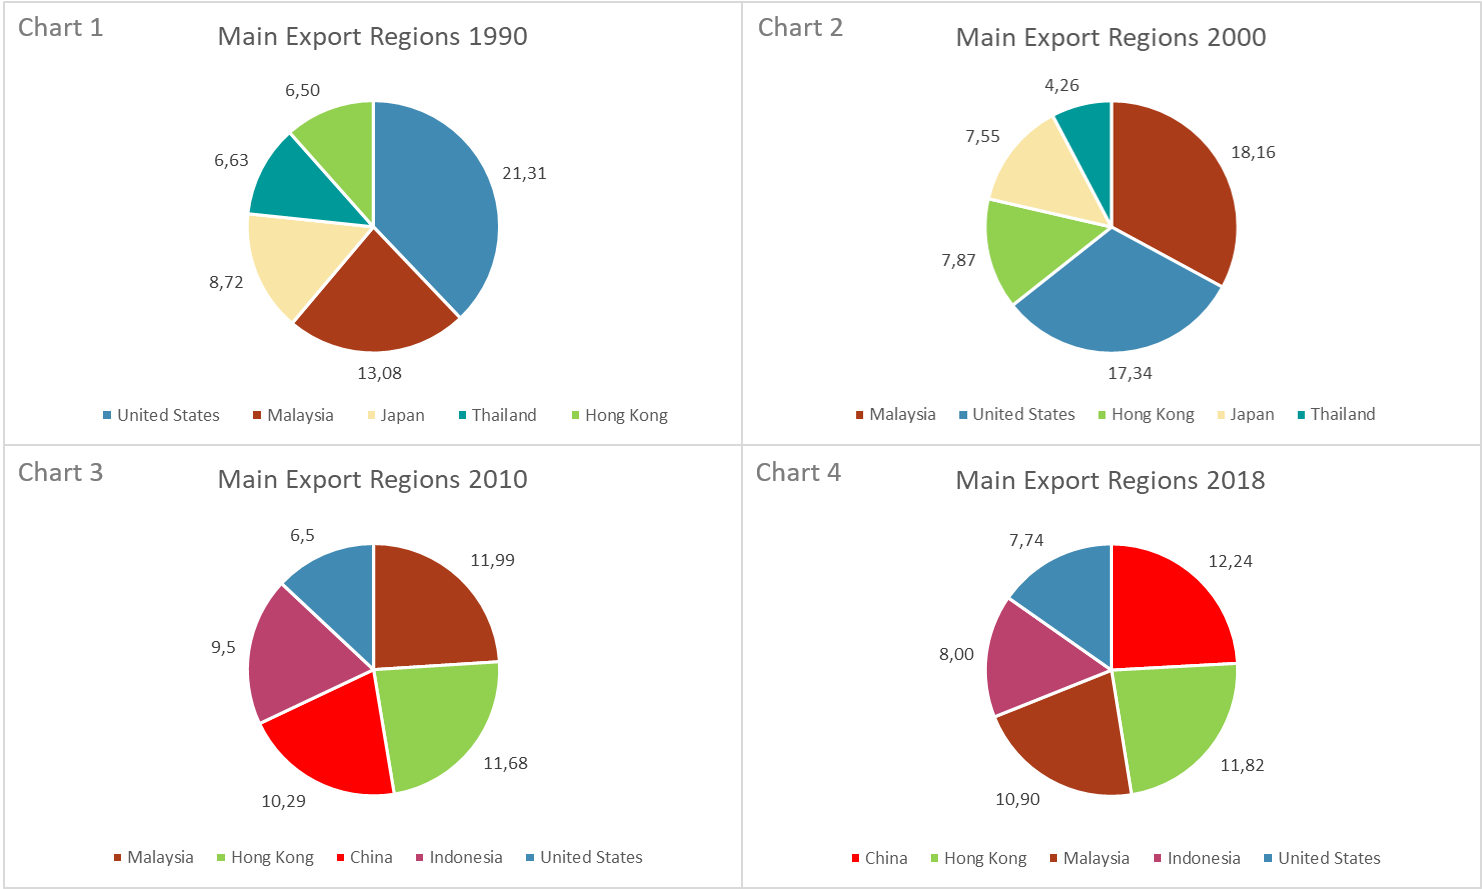
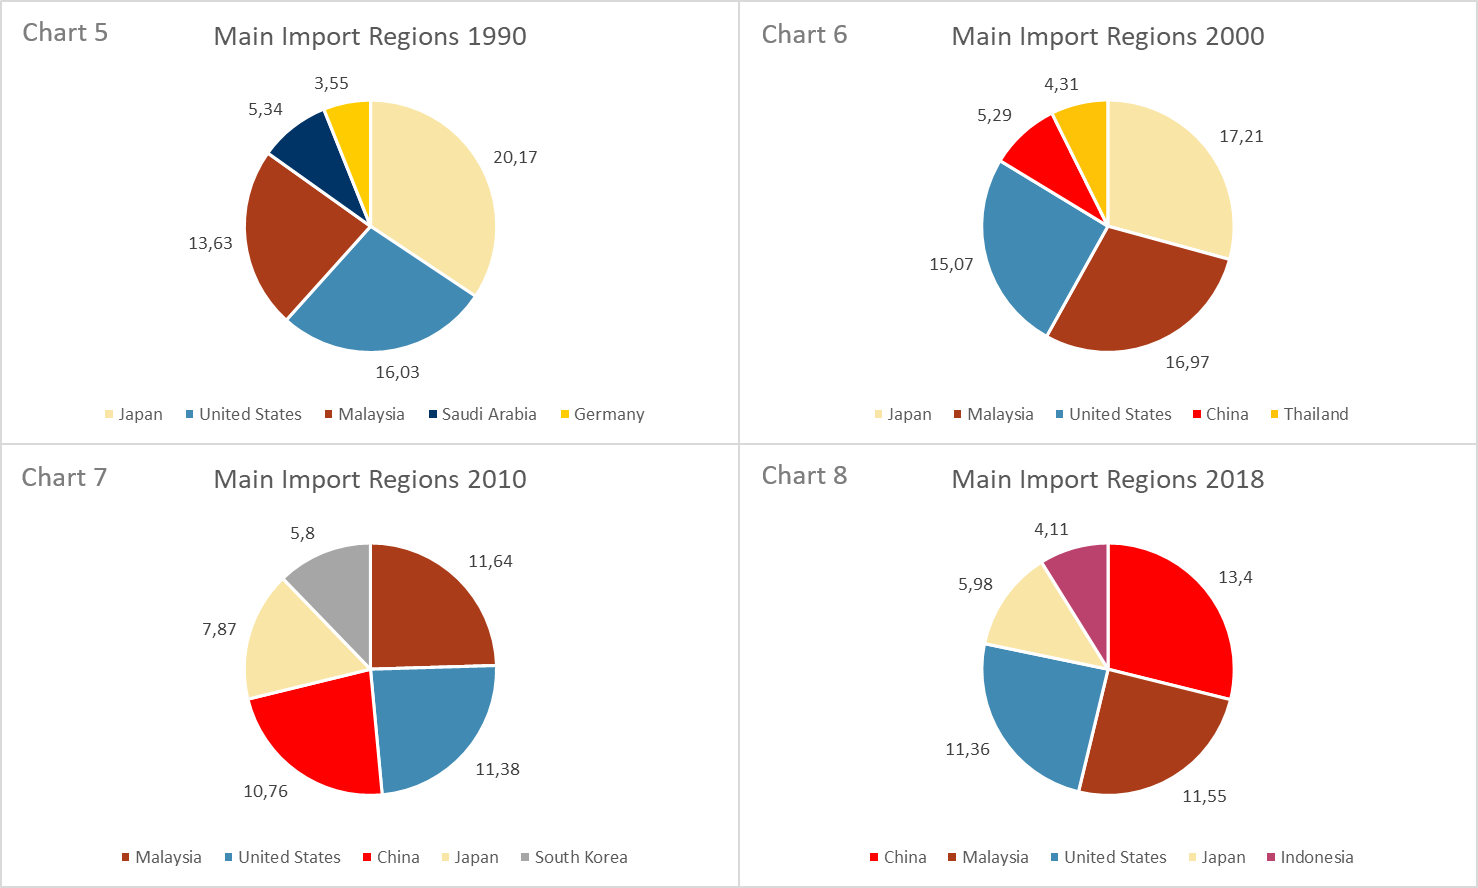
Singapore initiated a shift in the composition of its trading partners (see Table 1 and Charts 1 to 8, export partner shares and the respective import partner shares are assigned a percentage). Charts 1 to 4 illustrate the five most important export regions in 1990, 2000, 2010, and 2018, whereas Charts 5 to 8 refer to the same years but regarding the most important import regions. The data are provided by the United Nations Comtrade Database. Unfortunately, data for the years before 1990 are not available. However, the literature examining Singapore’s first period of growth provides insights into the roles of Singapore’s most important trading partners in the years before 1990.
In the 1980s, the US was Singapore’s most important trading partner and, as such, was “crucial to the country’s welfare” (LePoer 1991, p.154). In 1988, Singapore’s total exports to the US accounted for 24% of the nation’s total exports. Of that total, about 80% were Singaporean products, including semiconductors, parts of data-processing machines, television sets, radios, and disk drives (LePoer 1991; UN Comtrade Analytics 2020). Until 1989, Singapore and the other three NICs of Hong Kong, Taiwan, and South Korea enjoyed trade preferences with the US under the United States Generalized System of Preferences. This system was set up to support developing economies, but, in 1989, the four Asian NICs were removed from the program. The US had been trying for some time to “wrest trade and currency concessions from all four countries […] which had not been forthcoming. Washington presented the decision as an ‘economic graduation ceremony’” (LePoer 1991, p.155). However, experts interpreted the move as frustration over the US trading deficit despite considerable devaluation in the US dollar (LePoer 1991).
In 1990, as depicted in Charts 1 and 5, Singapore imported most goods from the US, Malaysia, and Japan, as well as exporting mainly to those countries. In 2000, Malaysia became the most important export destination. In 2010, other Asian economies, such as Hong Kong and Indonesia, grew in importance, while the share of the US had decreased to around 6.5%, and remained at 7.74% in 2018. The US comprised 21.31% of exports in 1990, and 17.43% in 2000. Even though fewer exports went to the US, they remain one of the five most important trading partners in terms of export today. The share of imports from the US into Singapore, however, has been stable, although a small decline from 16.03% and 15.07% in 1990 and 2000 to around 11.5% in 2010 and 2018 was registered. The main import region before the turn of the millennium was Japan, before being overtaken by China.
An interesting and important development is China emerging as the most important partner in terms of both import and export. The passing of the ASEAN-China Free Trade Agreement in 2003 and the Singaporean-China FTA in 2009 meant China quickly became one of the most powerful partners in terms of import and export. This, of course, correlates with China’s rise as a powerful economy and its economic expansion since the 2000s.
Data: UN Comtrade Database (2020)
Data: UN Comtrade Database (2020)
Data: World Bank
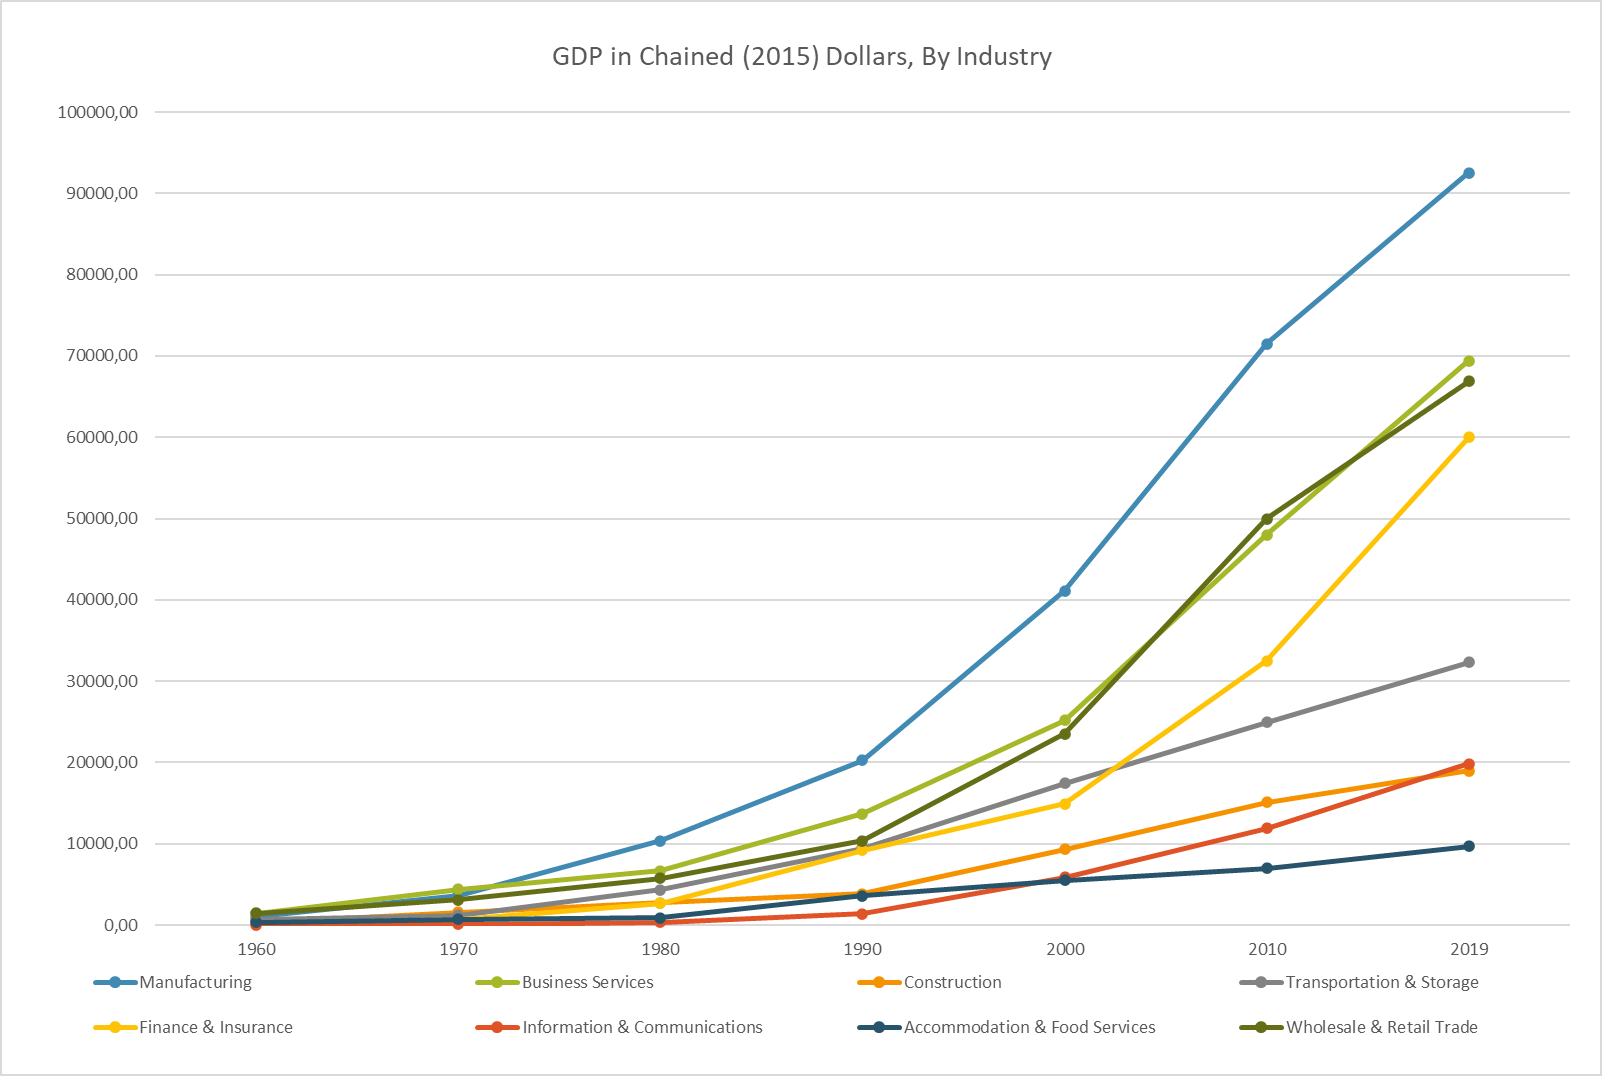
Graph 6 illustrates Singapore’s eight largest industries and how much they contributed to the GDP in chained 2015 dollars in 10-year steps starting in 1960. The data are taken from the national accounts provided by the Department of Statistics Singapore (2020).
The graph reveals that the manufacturing sector has been sharply increasing since the 1970s. It emphasizes how Singapore fulfilled its objective of establishing a strong manufacturing sector and industrializing the economy in its “first period of growth” and kept it as a core industry by modernizing the sector in the 2000s. The sector has not only been successfully implemented in the economy, but it has also become the sector that contributes the most to the nation’s GDP, even today. In the late 1990s and early 2000s, the business and service sector, the wholesale and retail trade sector, and the finance and insurance sector started accelerating. This development is in line with the government’s adjustment of its strategy in the “second period of growth.” Singapore’s new “Economic Openness” paid off: new, innovative sectors emerged, and, at the same time, the country’s GDP increased significantly. The transportation, storage, and communications industries have experienced steady growth since 1990, while accommodation and construction also grew, but not as significantly.
Graph 6 highlights what industries carried Singapore’s GDP growth from 1960 to 2019. It reveals that the city-state’s main sector has been and still is the manufacturing sector, which is why Singapore has greatly depended on exporting.
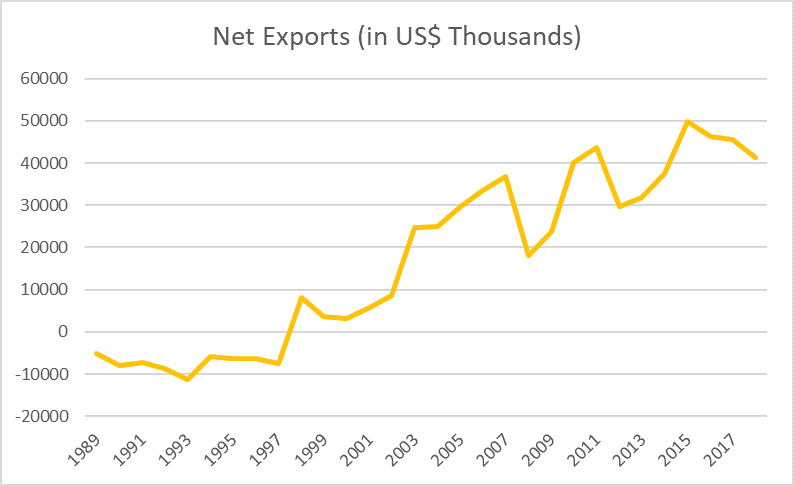
Net Exports
Data: World Bank
The net exports of a country are calculated by deducting total imports from total exports. Net exports provide a deconstructed view of economic growth. Graph 7 illustrates Singapore’s path to being a net exporter country, experiencing a trade surplus since the late 1990s. This development reveals that net exports comprise a major portion of the city-state’s GDP, which net exports are calculated into, stressing once more Singapore’s path to a successful exporting country.
Data: World Bank
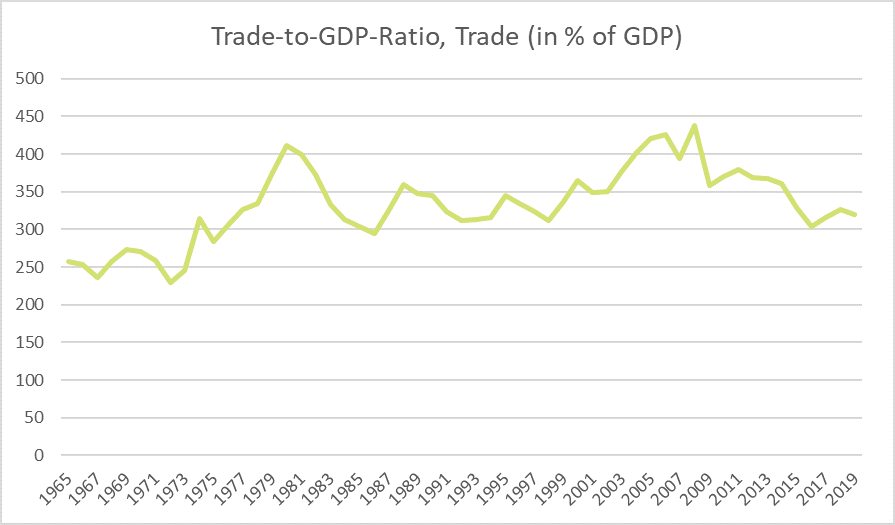
The trade-to-GDP ratio is an indicator of relative importance for trade in an economy. It is calculated by the aggregate value of imports and exports of a period divided by the GDP of the same period. The data for this line graph were retrieved by the World Bank (2020). They emphasize how heavily Singapore has been relying on trade. The city-state has had the highest trade-to-GDP ratio in the world, once hitting over 400% in 2008. In contrast, Germany’s trade-to-GDP-Ratio was 88% in 2019 (World Bank 2020).
It is clear that Singapore fulfilled its superordinate goal of economic growth. The city-state’s government relied heavily on FDIs to stimulate the industrialization process. At the same time, schemes to improve infrastructure and education made it possible to form Singapore into a manufacturing hub. The first period of growth laid the foundation for further growth in the 21st century, when the growth of GDP and GDP per capita sped up even more due to an influx of foreign workers and businesses. Throughout, Singapore relied mainly on export trade and has been, therefore, sensitive to recessions in the world market and dependent on foreign countries.
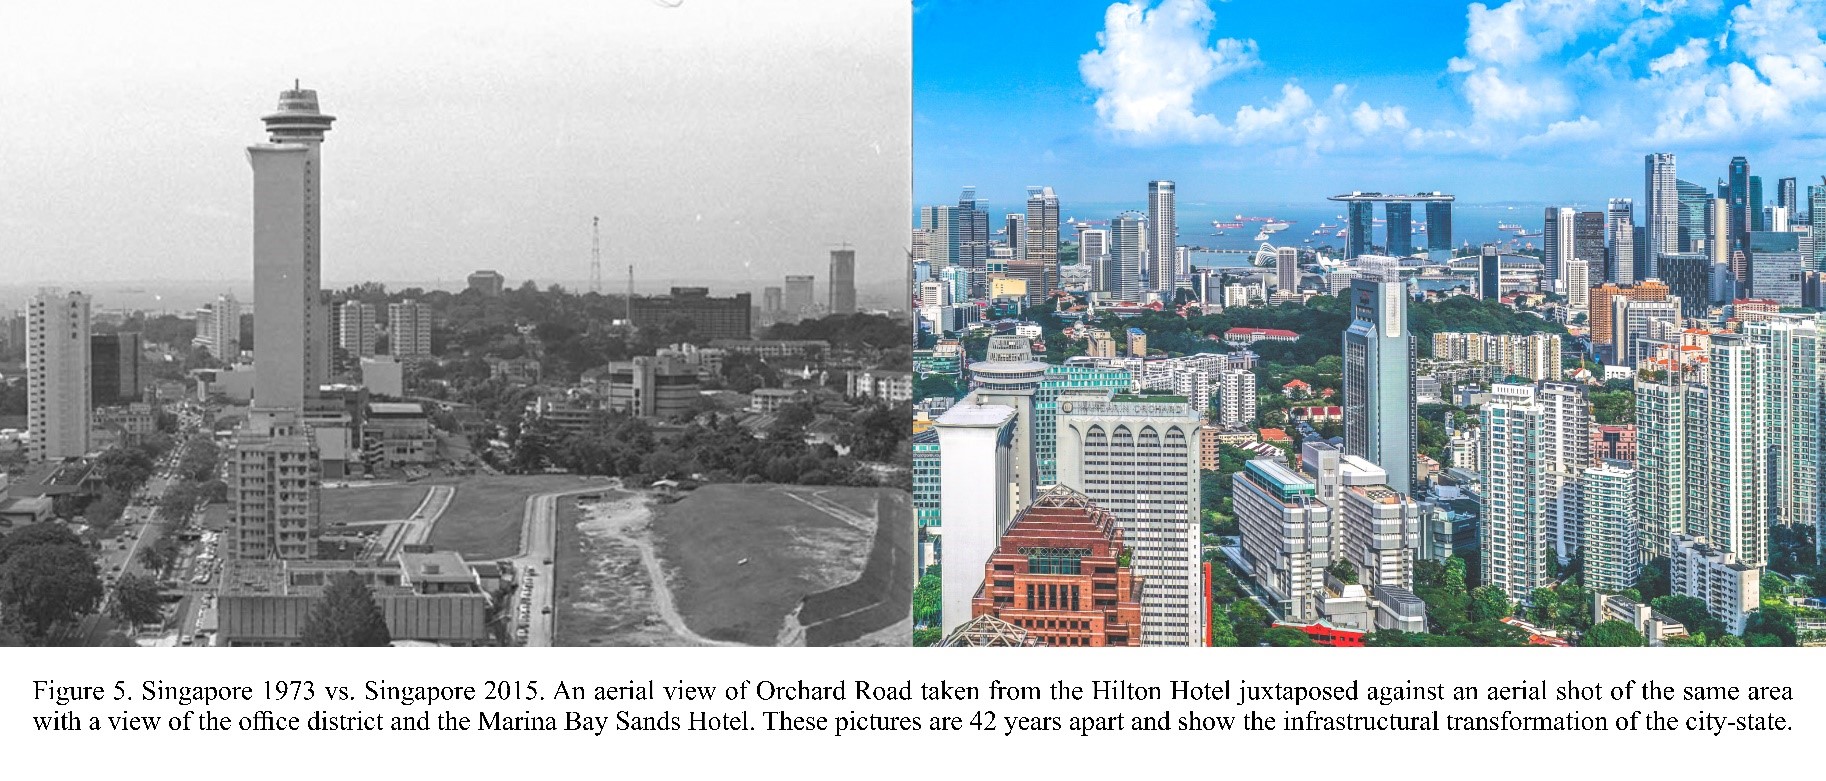
Left: Areal View of Orchard Road in 1973. Ong Wee Jin. Retrieved from: http://graphics.straitstimes.com/STI/STIMEDIA/Interactives/2015/07/who-owns-orchard-road/index.html (Accessed: 30.10.2020). Right: Areal View of Orchard Road, Civil District and Marina Bay in 2015. Mike Enerio. Retrieved from: https://unsplash.com/photos/tmqsL3BmZ80 (Accessed: 30.10.2020).
The Representativeness of Gross Domestic Product as a Measure of Economic Growth in Singapore
The second period of growth pushed Singapore’s GDP and GDP per capita growth to new heights. Today, Singapore is considered one of the richest countries in the world, at least according to the indicators of GDP and GDP per capita. According to the Economic Freedom Index, with a score of 89.4, Singapore is also ranked the world’s freest economy (The Heritage Foundation 2020). This index evaluates countries based on 12 factors, such as tax burden, government spending, labor freedom, and financial freedom. However, it is important to note that there is an underlying ideology problem: what is labor freedom for the laissez-faire economist is a lack of worker protection for the liberal economist. Therefore, Singapore is an interesting case for examining economic growth. The ideology that the long-term governing PAP followed was growth, and they succeeded – but at what costs?
Singapore moves between the extremes of astonishing economic growth and the limitation of fundamental rights and a lack of protection against economic volatility and government interventions for its citizens.
In the past five decades, Singapore grew in terms of architectural and infrastructural development, including an increasing number of superlative high-rise buildings and innovative living spaces combinding life in a tropical mega city with the challenges rising from increasing population growth. The pictures above indicate the difference between the Singapore of the late 1960s and the Singapore of 2015. However, these pictures do not say much about the actual wealth or wellbeing of the nation’s citizens. Similar to economic indicators such as GDP and GDP per capita, photographs (e.g. Figure 5) cannot include all the important information and perspectives crucial to understanding and evaluating an economy’s performance. What other indicators could help understand Singapore’s path to economic success in addition to the commonly used tools?
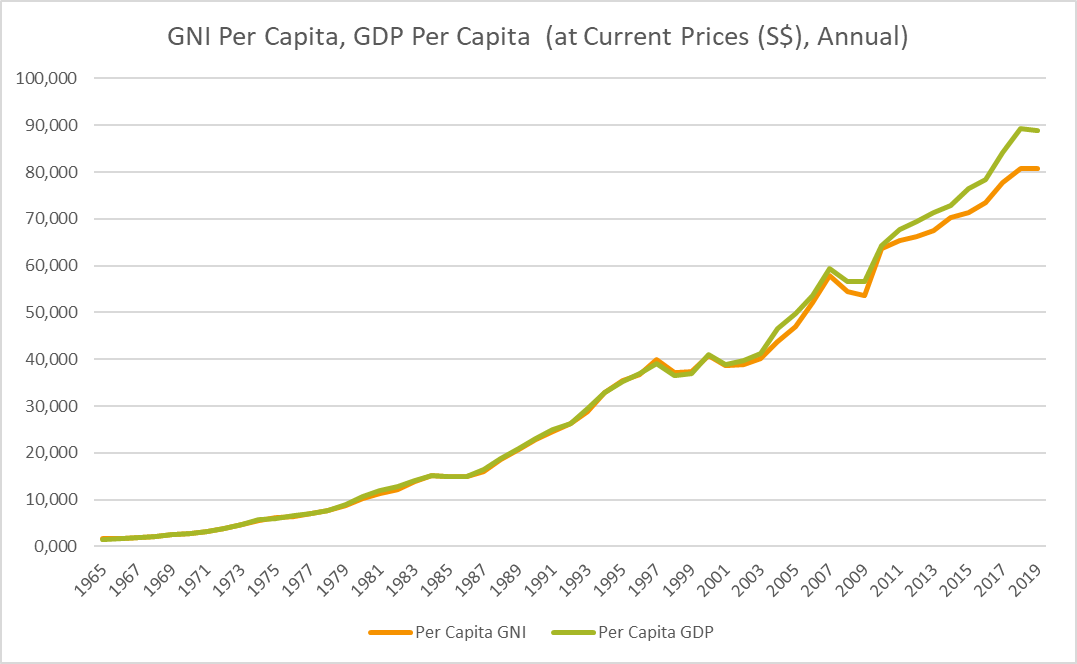
Gross National Income Growth
Gross national income measures the total domestic and foreign output claimed by residents of a country, reflecting how a country’s performance influences its citizens’ incomes. The following graph displays the same trend as GDP and GDP per capita in Singapore (Department of Statistics Singapore 2020). There is continuous growth, except for stagnation in the 1990s, a recession during the Asian Financial Crisis in 1997–98, and the Great Recession between 2007 and 2009. In 2019, Singapore’s GNI per capita, using PPP, was the third-highest in the world (World Bank 2019). Since 1990, the GNI has increased by more than four times.
Data: World Bank
With accelerating GDP, GDP per capita growth, GNI growth, and exports – does that mean all Singaporeans are richer and better off because of the nation’s economic development? A first approach to answering this question would be to consider the income distribution of different income classes in the country. A common way for economists to observe inequality in a country is by examining the difference between the lowest 10% and the top 10% of income classes in a country.
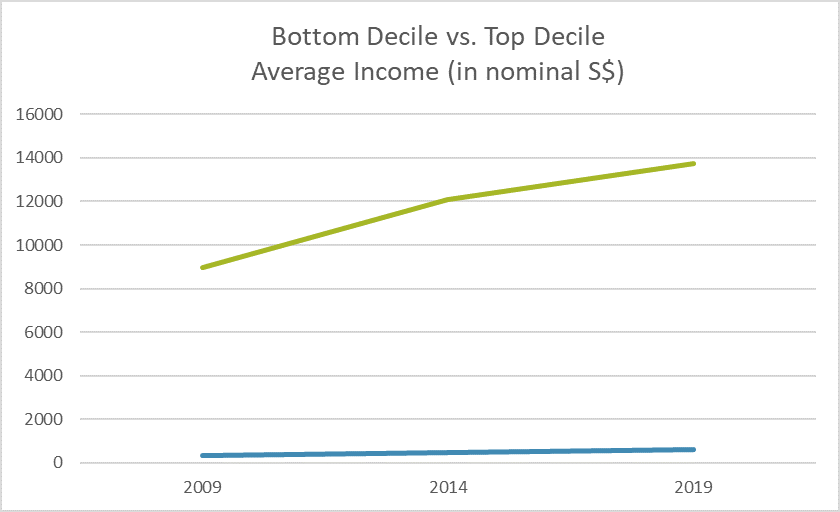
Department of Statistics Singapore in a survey of Key Household Income Trends (2019).
Analyzing the bottom and the top deciles of incomes in Graph 10, it is evident that the disparity has increased. The data were provided by the Department of Statistics Singapore in a survey of Key Household Income Trends (2019). While the top decile experienced an average income growth of around 9000S$ to 14000S$ (in current S$), the bottom decile barely increased. It is important to note that the values in Graph 10 are given in nominal terms and remain unadjusted to changes in price level. While GDP, GDP per capita, and GNI increased during this period, the wages of the lowest average income classes have not changed significantly. Somehow, the money Singapore is earning is not influencing the income of the bottom decile.
The Gini coefficient is another indicator of inequality in a country. The coefficient ranges between 0 and 1. A high value on this scale indiciates high inequality, while a low value indicates a more equal society. Singapore’s Gini coefficient rose from 0.454 in 2002 to peak at 0.482 in 2007. In 2012, the coefficient hit 0.478 before decreasing again. The number recently hit a new low, with a coefficient of 0.452 in 2019. (Department of Statistics Singapore 2019). While this might suggest an improvement of inequality, huge disparity between high- and low-income classes, as depicted in Graph 8, remains. It is important to note that data on inequality in Singapore are difficult to collect as “data sources and measurement changes through the years” (Ng 2015, p.3), The main factor affecting Singapore’s national income is property income, which is expected to be much more unequally distributed than labor income. However, general inequality trend lines for Singapore can be approximated. The rising disparity and the measurement problems that neglect important factors pose the question of how well-off low-income classes in Singapore are.
Poverty
There is little to confirm the social welfare of Singapore’s lowest income-distribution decile as there are no reliable data available. Singapore does not use an international standard, nor does it have a national poverty line (Department of Statistics Singapore 2020). The comment on the proportion of the population living below the national poverty line is “not applicable” (Department of Statistics Singapore 2020). Sporadic estimates had been provided by Lim Chong Yah in a report from 1988. However, in the 1990s and 2000s, there have not been any follow-up reports of poverty rates (Ng 2015, p.5). Given Singapore’s “level of development and wealth, it is a commonly held view that poverty does not exist in Singapore, or that domestic poverty is not comparable to the absolute poverty that is present globally” (Donaldson et al. 2013, p.60). The economic success was “accompanied by a perception that […] poverty had been eradicated” (Ng 2015, p.5). Nonetheless, Singapore includes eradicating extreme poverty, which is defined by living on less than S$1.25 a day, in its “Sustainable Development Goals” (Department of Statistics Singapore 2020).
The “first-ever count” (NUS News 2019) of homeless people in Singapore was conducted in 2019. So far, homelessness has not been an openly discussed topic in Singapore. Under the Destitute Person Act (1989), people who live on the street and are begging can be arrested. The study on homelessness in 2019 was a first step to draw attention to this social problem in Singapore. While the costs of living have risen dramatically in the past few decades, social problems such as poverty and inequality should be included more in discussions of Singapore’s economic performance. However, Singaporean officials are yet to establish a mechanism to examine poverty and low-income classes that are comparable to international standards. How Singapore has been dealing with social problems reflects the government’s value orientation and, once again, emphasizes the narrow focus on economic growth (Rahim 2015).
The Housing & Development Board is Singapore’s public housing authority. Over 80% of Singaporeans live in the so-called “HDBs.” This housing serves as not only a solution for an increasing population on scarce land, but they are also used for racial integration. The HDB Ethnic Integration Policy ensures a balanced mix of various ethnic communities in HDB towns (Housing & Development Board 2017). Initially, the HDB aimed to provide housing to clear slums, but HDB resale prices have been increasing strongly.
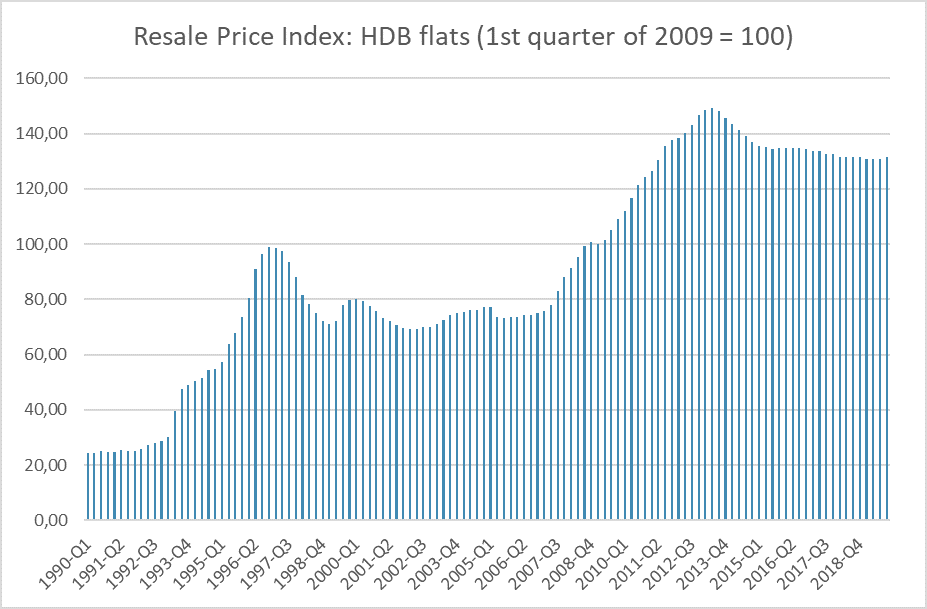
Housing & Development Board (2019)
Graph 11 illustrates the overall price movements of HDB flats quarterly since 1990. The 1st quarter of 2009 is the base period (1st quarter of 2009 = 100). According to the index provided by the Housing & Development Board, housing prices had increased by over 30% in 2019 compared with 2009. In the early 1990s, HDB flats were over 70% cheaper compared with 2009. This price rise was caused by an increasing population but scarce land. The graph only considers resale flats and excludes BTOs (Build-To-Order) buildings, as BTOs may be cheaper when purchasing. However, BTOs require a waiting time of three to four years until they are built. Additionally, a certain eligibility needs to be met to be allowed to apply for a BTO, (e.g. married couples are treated favorably in the BTO application process). Since housing prices are so high in Singapore, it is very common for several generations to share the limited space of one flat, and adult children stay with their parents until they marry and receive a BTO. The situation for low-income workers is different, however, for example, migrant workers on construction sites. Cases of overcrowded and unsafe living conditions in dorms are fragmentarily reported and often overlooked (Channels News Asia 2018). While this may reflect badly on the country’s government, similar to poverty, information is very often not obtained.
Future Challenges
In 1963, before Singapore became independent, Lee Kuan Yew stated he wanted to make Singapore the “New York of Malaysia” (Peebles & Wilson 1996, p.36). Singapore had not been part of the Malaysian Federation for long when this statement was made, yet Yew has undoubtedly turned Singapore into the global city it is today. Of course, the nation’s development has been helped by the uninterrupted rule of the PAP. Its macroeconomic policies have determined Singapore’s development and economic success. However, the government needs to adapt. A rising disparity between poor and rich, increasingly high housing prices and costs of living, as well as rising population density, threaten life quality in Singapore. The change from GDP Bonus to National Bonus, which includes more indicators of the wellbeing of Singaporean citizens, might be a nice gesture, but actions need to follow.
Singapore’s growth depends highly on world economic developments. The strong volatility of such developments affects incomes and, thus, the wellbeing of its citizens. Even though there has been overall growth, the GDP, GDP per capita, and income of Singaporeans have been affected by crises and recessions. Singaporeans remain not only unprotected by developments on the world market, they are also exposed to the rule of the Singaporean government. Singaporean citizens take great pride in their nation’s prosperity and economic development. However, Singapore’s great economic progress has occurred at the expense of its citizens’ freedom. Even today, there is limited freedom of speech, freedom of the press, and freedom to assemble. According to the Press Freedom Index, Singapore is one of the most oppressive countries in the world, occupying rank 159 out of 180 (Reporters Without Borders 2020). So far, the wellbeing of the economy has been a superordinate goal more or less collectively accepted by Singaporean citizens, and Lee Kuan Yew has been celebrated as a “founding father” figure who has led the country to prosperity. However, recent events have revealed that Singaporean citizens and politicians have started discussing their economic model and its disadvantages and problems more openly. During the campaign for the general elections in July 2020, the Workers Party, the opposition to the PAP, called for a “re-examination of [their] nation’s economic model, to finally raise the productivity of [their] workers that has so far eluded [them], and to finally enable [them] to work not just hard, but also smart” (Jamus Lim 2020).
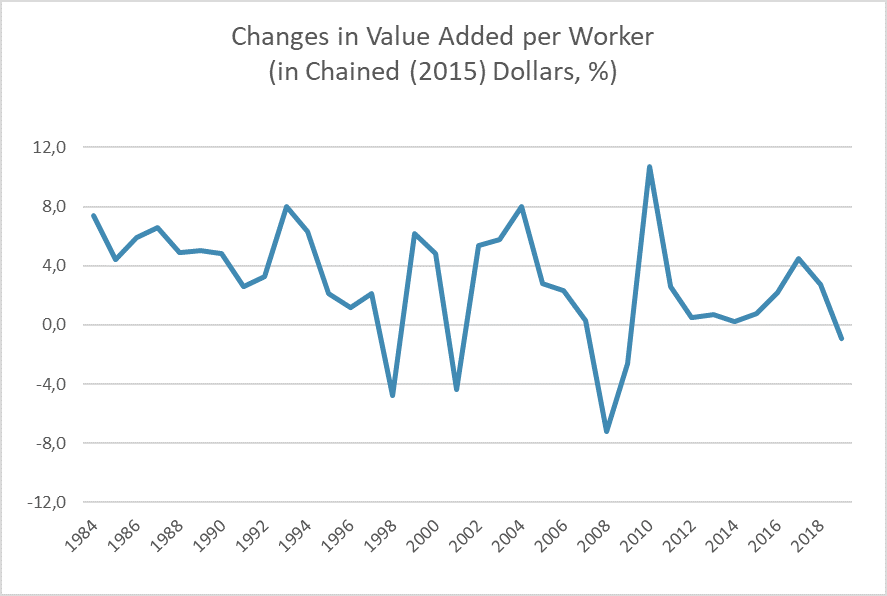
OECD Statistics Directorate 2008
Graph 12 illustrates the changes in value-added per worker, which is only one of the various ways to examine labor productivity (OECD Statistics Directorate 2008). Value-added is the volume measure of output. While there were positive labor-productivity rates until 1998, they have grown more volatile and have been decreasing since 2017. The labor-productivity rates, therefore, have not always been low, but declined in the past few years. In 2013, the Ministry of Trade and Industry identified a strong growth in less-skilled workers in the construction sector, which is considered to have caused a decline in labor productivity in the years before 2013 (Ministry of Trade and Industry 2014). Singapore’s current low labor-productivity rates have been worrying researchers and politicians alike, questioning the sustainability of the city-state’s economic model as this rate is argued to be a central precondition and a key indicator of economic growth (Vu 2011).
Recent studies on Singapore have recommended rethinking the current growth model to sustain the city-state’s high economic performance in the long term. At the same time, voices have been raised to draw more attention to social problems.
Singapore’s history of economic growth is a history of success. While it is important to understand countries within their own cultural context, the flipside of Singapore’s strong government control and its interventionist policies that restrict individual freedom, as well as the prioritization of the economy’s needs over its people, is not negligible and should always be included when examining Singapore’s economic growth.
References
- Asia-Pacific Economic Cooperation, The Impact of SARS on the Singapore Economy and Action Taken in Response, in: Asia-Pacific Biotech News 12, 8, 2004, pp. 672 – 678.
- Chong-Yah, Lim, Singapore. Resources and Growth – An Introductory Overview, in: Lim Chong-Yah, Peter J. Lloyd, (Ed.), Singapore. Resources and Growth, Singapore 1986, pp. 1 – 16.
- Chowdhury, Anis; Islam, Iyanatul, The Newly Industrialising Economies of East Asia, London 1993.
- Donaldson, John A.; Loh, Jacqueline; Mudaliar, Sanushka; Md Kadir, Mumtaz; Wu, Biqi; Yeoh, Lam Keong, Measuring Poverty in Singapore. Frameworks for Consideration, in: Social Space, 2013, pp. 58 – 66.
- Huff, W.G., What is the Singapore Model of Economic Development?, in: Cambridge Journal of Economics 19, 1995, pp.735 – 759.
- Jordan, Rolf, Singapore in its Worst Recession for Years. The Effects of the Current Economic Crisis on the City-State’s Economy, in: Journal of Current Southeast Asian Affairs 28, 4, 2009, pp. 95 – 110.
- LePoer, Barbara Leitch (Ed.), Singapore. A Country Study, Washington 1991.
- Ng, Irene Y.H., Being Poor in a Rich “Nanny State”. Developments in Singapore Social Welfare, in: Singapore Economic Review 60, 3, 2015, pp. 1550038-1 – 1550038-17.
- Peebles, Gavin; Wilson, Peter, The Singapore Economy, Cheltenham 1996.
- Rahim, Lily Zubaidah, Reclaiming Singapore’s ‘Growth with Equity’ Social Compact, in: Japanese Journal of Political Science 16, 2, 2015, pp.160 – 176.
- Siow-Yue, Chia, Direct Foreign Investment and the Industrialization Process in Singapore, in: Lim Chong-Yah, Peter J. Lloyd, (Ed.), Singapore: Resources and Growth, Singapore 1986, pp. 79 – 117.
- Song, Tan Kim; Bhaskaran, Manu, The Role of the State in Singapore. Pragmatism in Pursuit of Growth, in: The Singapore Economic Review 60, 3, 2015, pp. 1550030-1 – 1550030-30.
- Vu, Khuong M., Sources of Singapore’s Economic Growth 1965-2008. Trends, Patterns and Policy Implications, in: ASEAN Economic Bulletin 28, 3, 2011, pp. 315 – 336.
- Yew, Lee Kuan, Interview with Nathan Gardels. The East Asian Way – With Air Conditioning, in: New Perspectives Quarterly, 2009, pp. 111 – 120.
- Channel News Asia, Construction Company Fined for Housing Foreign Workers in Cramped, Filthy Conditions, 29 May 2018. Retrieved from: https://www.channelnewsasia.com/news/singapore/construction-company-keong-hong-fined-foreign-workers-housing-10285764 (Accessed: 23.01.2021).

Sarah Stricker
MA History & Economics Student