Inequality in South Africa since 1960
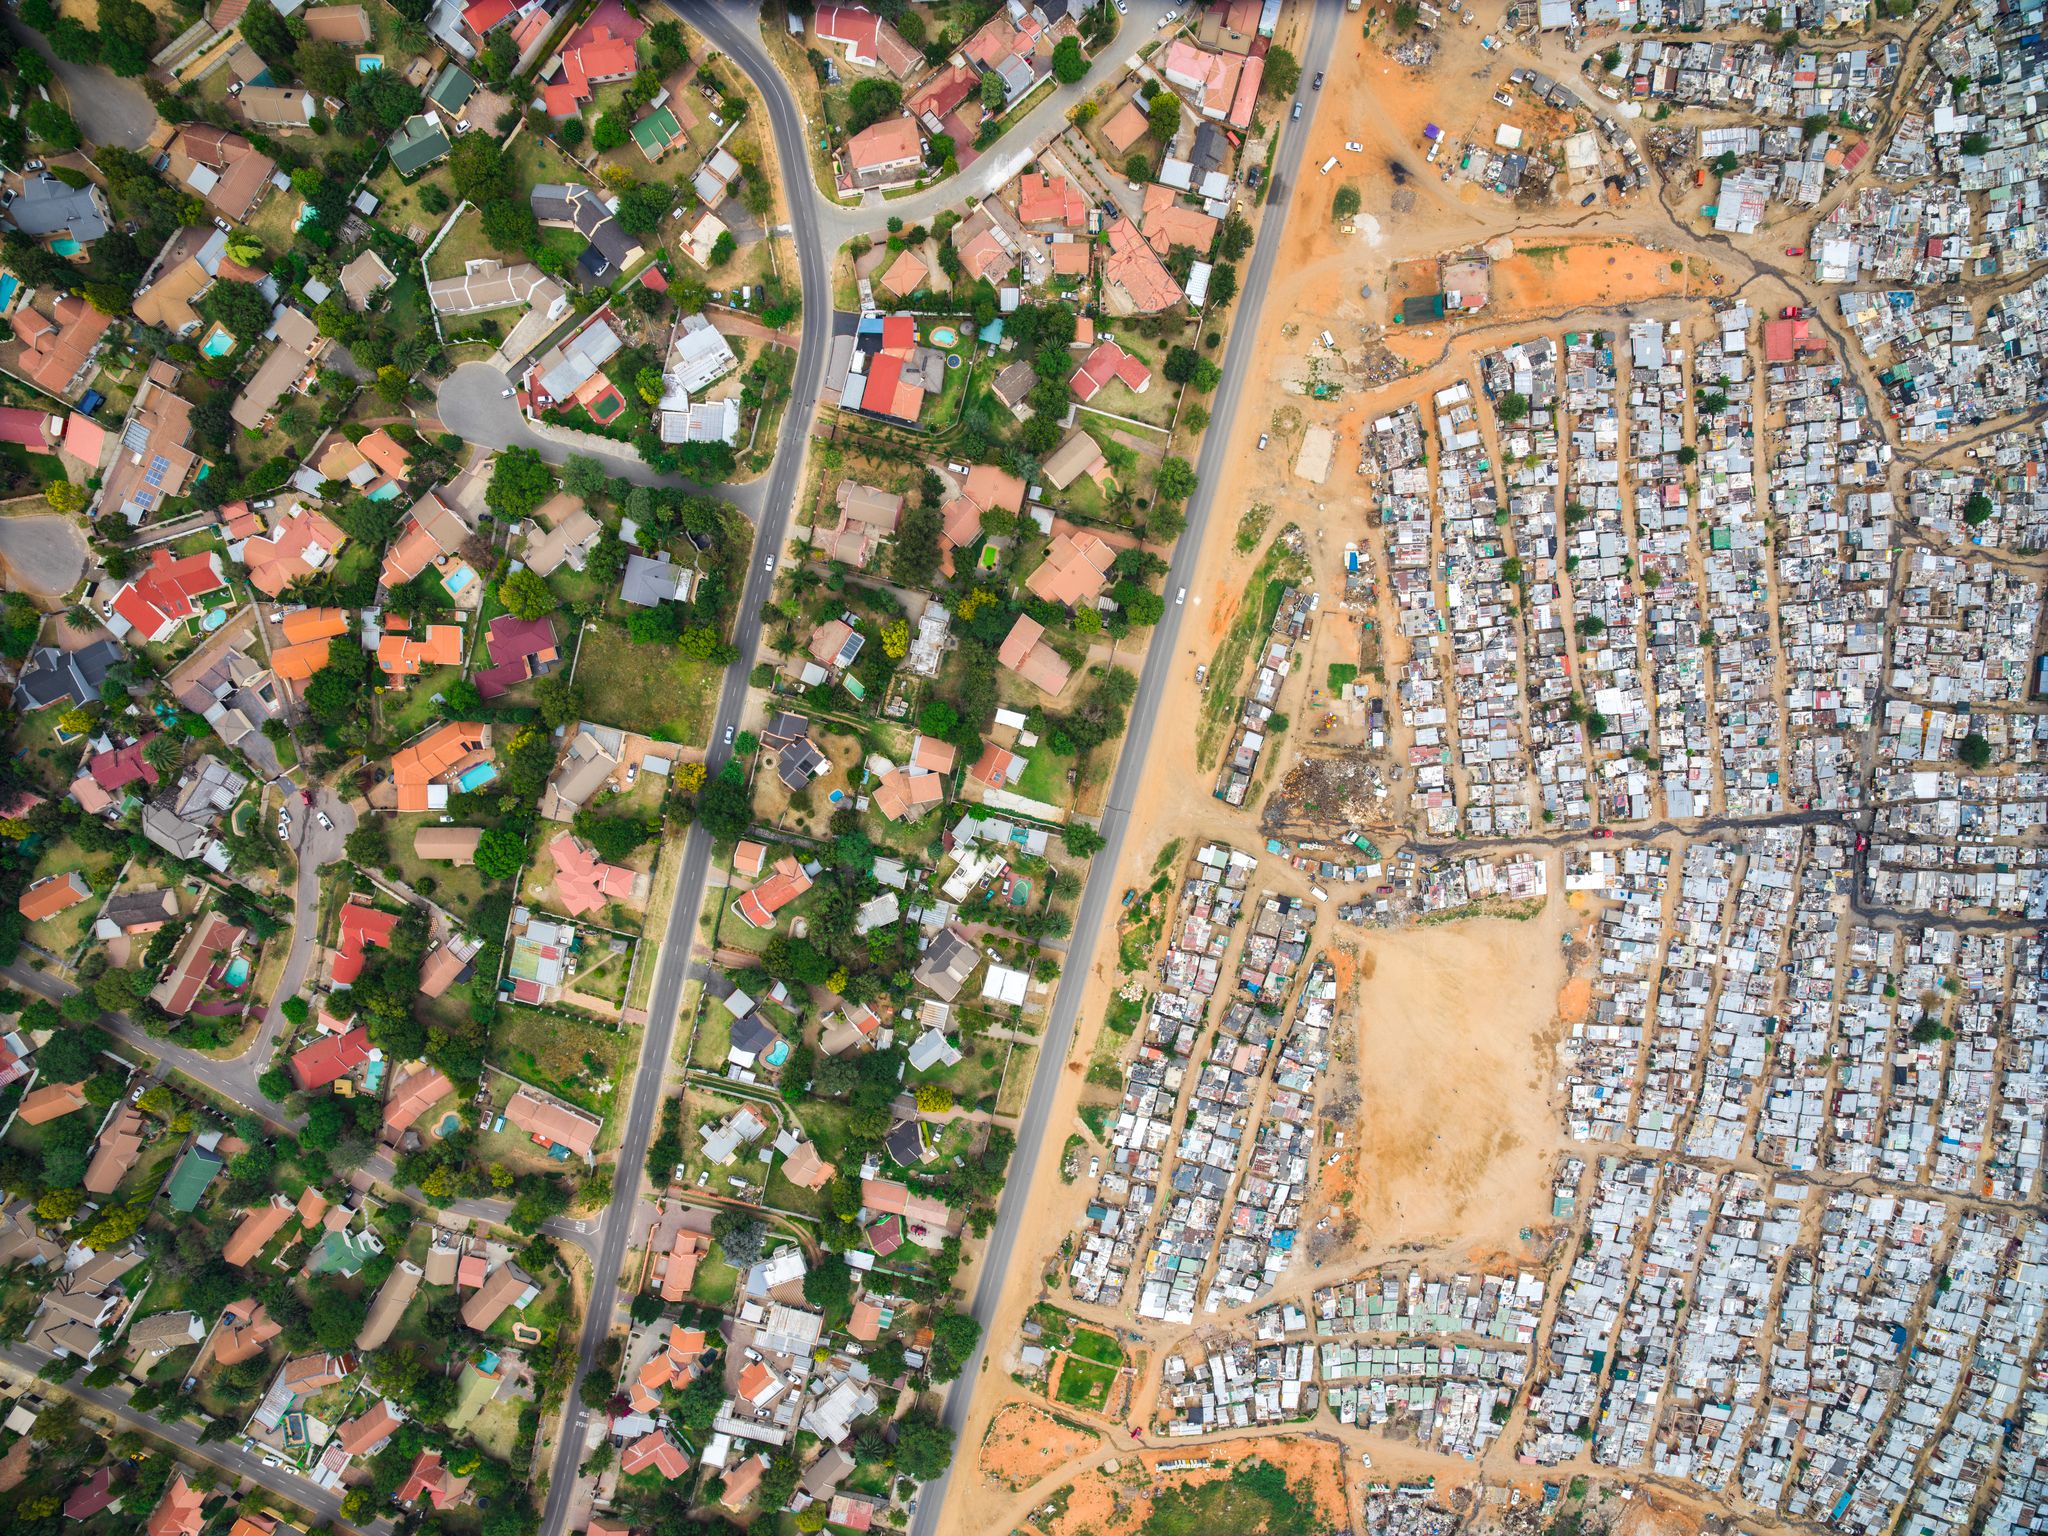
Image 1.1 Aerial photo of Primrose (left), a middle-class suburb, and Makause (right), an informal township (slum) without streets, sewage, or running water. The neighboring settlements lay 14 km east of Johannesburg, South Africa’s largest and most affluent city. Source: Johnny Miller/ Unequal Scenes
South Africa
Main Theme
Hailed “the world’s most unequal country” by TIME Magazine in 2019, economic inequality in South Africa is an issue deeply rooted in the country’s colonial roots, its segregationist apartheid-past, and the persistence of physical geographies intended to, and continue to, divide the developing nation’s social landscape (Pomerantz, 2019). Since the end of apartheid in 1994, South Africa has made great strides toward becoming a more prosperous and equal society. However, the legacy of racial segregation and the mismanagement of the post-apartheid regime continue to plague modern South African society. In this research, I critically examine current studies and the available data for two forms of inequality in South Africa: wealth and income. I focus largely on race as a determinant of inequality.
State of Research: Data & Sources
Following Thomas Piketty’s pioneering research on wealth and income inequality, multiple new economic studies in the past decade have attempted to create reliable wealth and income-distribution estimates for several nations in the hope of obtaining closer insights into patterns and levels of inequality over time. One nation for which the results of such inequality studies have garnered considerable attention in recent years is South Africa, a nation long plagued by division and discrimination. While the field is still somewhat new and studies rather scarce, a handful of sources stand out as having been used as reliable estimates of incomes and wealth in South Africa. To build upon and contextualize these mainstream estimates, I also examine several qualitative and socio-political factors and data (e.g. political events, housing prices, infrastructure and geography).
For the most current research and datasets pertaining to wealth and income inequality in South Africa, I examined the baseline data series used by the World Inequality Database (WID). Anthony B. Alvaredo’s 2011 study Top Incomes in South Africa: 1903–2007 provides a broad and fairly reliable data series on income distribution in the African nation. Alvaredo’s estimates are based primarily on tax records stretching back to 1903, with survey data supplementing the gray areas. The WID has awarded these data a 3/5 star rating. Alvaredo’s data for the top 1% and top 10% of the population can be estimated as having a high degree of certainty, but he acknowledges that the data likely cannot accurately capture the true economic advantage for those at the top given South Africa’s history of disenfranchizing Black and Colored peoples. This is a point I return to in my discussion of the data.
For wealth estimates, I consider Chatterjee’s 2020 study of household wealth estimates – also the baseline data source for wealth in the WID. I also review Anna Orthofer’s 2016 work, which served as the WID’s baseline wealth data source until it was replaced by Chatterjee 2020. Whereas Orthofer’s work provides a broader macroeconomic analysis, with wealth estimates between 1970 and 2010, Chatterjee’s estimates are exclusively for the post-apartheid period 1994–2018. Wealth-distribution trends in the post-apartheid period raise interesting insights and important questions regarding the long-term economic effects of segregation, colonialism, and political disenfranchisement.
I also examine wealth and income data provided by the South African Department of Statistics in their most recent report (2019) and in their online database. Although neither the data series nor the methods used by Stats SA are available to the public, the metrics used to measure and portray inequality, as well as the findings published in its report, are worth examining. These data help create a clearer picture of recent developments (since 2010) in inequality in South Africa. Regarding the data quality, statistics published by government agencies can vary in accuracy and reliability; yet those vetted and sanctioned by international institutions such as the World Bank and OECD can be trusted.
Finally, I also consider visual sources, specifically aerial photographs from the collection “Unequal Scenes,” displaying geographical/locational inequalities. For the regions photographed, I examine current average incomes using the website payscale.com, estimated incomes in slums using articles from TIME and the New York Times, average property sale prices since 2011 from the website property24.com, and population estimates from the South African Census Bureau.
Apartheid and its Lasting Economic Consequences
Since the arrival of the Dutch in 1652, and throughout South Africa’s long colonial history, the peoples and lands of Africa’s southern cape have been subjected to both informal and formal systems of racial stratification, exclusion, and enslavement by a White ruling minority. During the British colonial period (1806–1910), codified systems of racial segregation against Black natives and “creolizeds” or “coloreds” of mixed-race emerged following the abolition of slavery in 1833. These systems protected the property holdings and political power of the ruling White elites. The privileges enjoyed by Whites would continue to receive legislative protection within the independent Union of South Africa following 1910, but rapid industrialization and wartime labor shortages resulted in the upward mobility of large numbers of Black Africans. During, and in the aftermath of, the Second World War, Black migrant workers flocked to urban centers in search of opportunity, a migration flow that the government largely ignored. Without social services or adequate housing, conditions in Black urban communities quickly deteriorated and crime rates increased. In the lead-up to the 1948 parliamentary elections, the South African National Party rose to prominence, preying on the fears and the growing perception that Black urbanization was putting the White minority’s prosperity increasingly at risk. Running on the policy of apartheid (apart-ness), the party called for a formal, codified system that set out the privileges and rights of South Africa’s different race groups, the implementation of racial segregation, and above all, the hegemony of the White minority through the policy of baasskap or “boss-ship.” The National Party received the majority vote in the 1948 elections and immediately implemented the policy of apartheid: a word that came to define South African politics and society for nearly five decades to follow1.
Under the National Party’s apartheid regime, Black Africans (by far the largest demographic group, comprising 70% of the population in 1960) faced discrimination in nearly every aspect of their lives. The Prohibition of Mixed Marriages Act of 1949 outlawed inter-racial marriage, and the Population Registration Act of 1950 classified all citizens into four race groups: Black, White, Colored, and Indian. Furthermore, non-Whites were stripped of their voting rights and forced to use separate public facilities, public transport, and attend separate schools from Whites2. Although abolished in 1994 after negotiations between the National Party and Nelson Mandela’s African National Congress (ANC), plus decades of violent protests and widespread international backlash, apartheid and its legacy have left deep social and economic scars in South African society. Two particular apartheid-era policies I have found to be both highly intriguing and highly relevant for this study on wealth and income inequality are the Group Areas Act of 1950 and the Bantu Homeland Acts of 1951 and 1970.
The Group Areas Act of 1950 established a policy of resettlement that banned and broke up mixed communities, cleared out urban slums and designated settlements, towns, neighborhoods, and “group areas” according to race. The Bantu Authorities Act of 1951 set up the legislative groundwork for the National Party’s grand scheme to not only divide settlements based on race, but to expunge “blackness” entirely from South African demographics. The act established independent, self-governing homelands for Black Africans called Bantustans and, combined with the Group Areas Act, it resulted in the forced relocation of nearly 3.5 million Black Africans out of South African cities and into autonomous “homelands.” Then, in 1970, Black Africans were stripped of their South African citizenship through the Bantu Homeland Citizenship Act and were made citizens of one of the ten Bantustan homelands. Those seeking work outside of their Bantustan were treated as migrant workers and required work permits. However, with few opportunities in rural Bantustan-regions, many Black Africans flocked to South Africa’s economic centers such as Johannesburg or Cape Town to seek work4.
Throughout the 1970s and 80s, informal settlements of internal migrants, “townships,” began to sprout around the outskirts of South African cities, often adjacent to White middle-class neighborhoods, golf courses, or parks. Legally and financially incapable of purchasing property in the suburbs or city neighborhoods, Black Africans who sought work in urban centers were relegated to the outskirts, off the grid and unrecognized by the state. Comprising scrap-metal huts and lacking running water, electricity, or public infrastructure, these Black African slums have not simply disappeared in the years since apartheid – rather, they have grown exponentially and are growing still. The long-term, economic implications of forced relocation, disenfranchisement, and the policies of geographical segregation during the apartheid era are reflected in attempts in current research to estimate wealth and income distributions and inequalities5.
Key Indicators: Income Inequality
Regarding income inequality, I examine estimates from the South African Department of Statistics online database, as well as the WID for South Africa plus several leading world economies, including China, France, Germany, and the US. The period of interest I have chosen for incomes is 1960–2019, with the intention of capturing global, post-Second World War trends, as well both apartheid-era and post-apartheid trends for South Africa. Using WID estimates, I first examine income-distribution trends as a total percentage share of national income for the top 1%, top 10%, and bottom 50% in the above-mentioned countries.
Baseline income data for South Africa in the WID come from Alvaredo et al.’s (2011) series, which draws primarily on historical income tax return data dating to 1903, as well as household surveys, a relatively recent strategy used in national accounting. Alvaredo’s base unit of analysis is, however, the individual and not the household, assuming that incomes within couples and families are not shared. Furthermore, given the nature of historical taxes and those who paid them, Alvaredo’s dataset is somewhat limited to a rather small, wealthy minority of the South African population who would have earned enough to even qualify for taxation. This holds true for the period between 1960 and 1994, for which the explanatory power of Alvaredo’s data is somewhat limited to inequalities among the top income percentiles. The period from 1994 to 2001 (immediately following the end of apartheid) saw major changes to tax code structure and to the fabric of South African society itself. Therefore, tax return data are unavailable for this period – Alvaredo relies on household surveys from 1993 and 2000 to create estimates and bridge the gap until tax return data were once again available in 2001, but he hesitates to make any strong assumptions about top incomes in the years immediately following apartheid6. Current, baseline estimates for China (Piketty & Yang Zucman, 2016), France (Gabartini & Piketty, 2018), Germany (Bartels, 2018), the US (Piketty, Saez, & Zucman, 2016) were gathered from the WID7.
In Figure 1, the share of national income owned by the top 1% in South Africa has been, since the mid-1960s, relatively high when compared with the industrial economies of the US, Germany, and France. Throughout the apartheid regime, however, South African top 1% income shares, although relatively high, seem to have been decreasing, following a larger, global downward trend through the 1970s and 1980s. While US top 1% income shares had been steadily rising thought the 1980s, German, French, Chinese, and South African shares remained stagnant, somewhere between 7.5 and 12.5%. However, in 1994, the year that witnessed the end of apartheid in South Africa and the rise of Mandela’s ANC leadership, there is a rapid upward trend in top 1% incomes. This trend continued throughout the 1990s and 2000s, with South Africa ultimately catching up to US levels by 2008 (a 10% spike in only a 14-year period). The top 1%’s income share in South Africa has since remained on par with US levels and is one of the highest in the world.
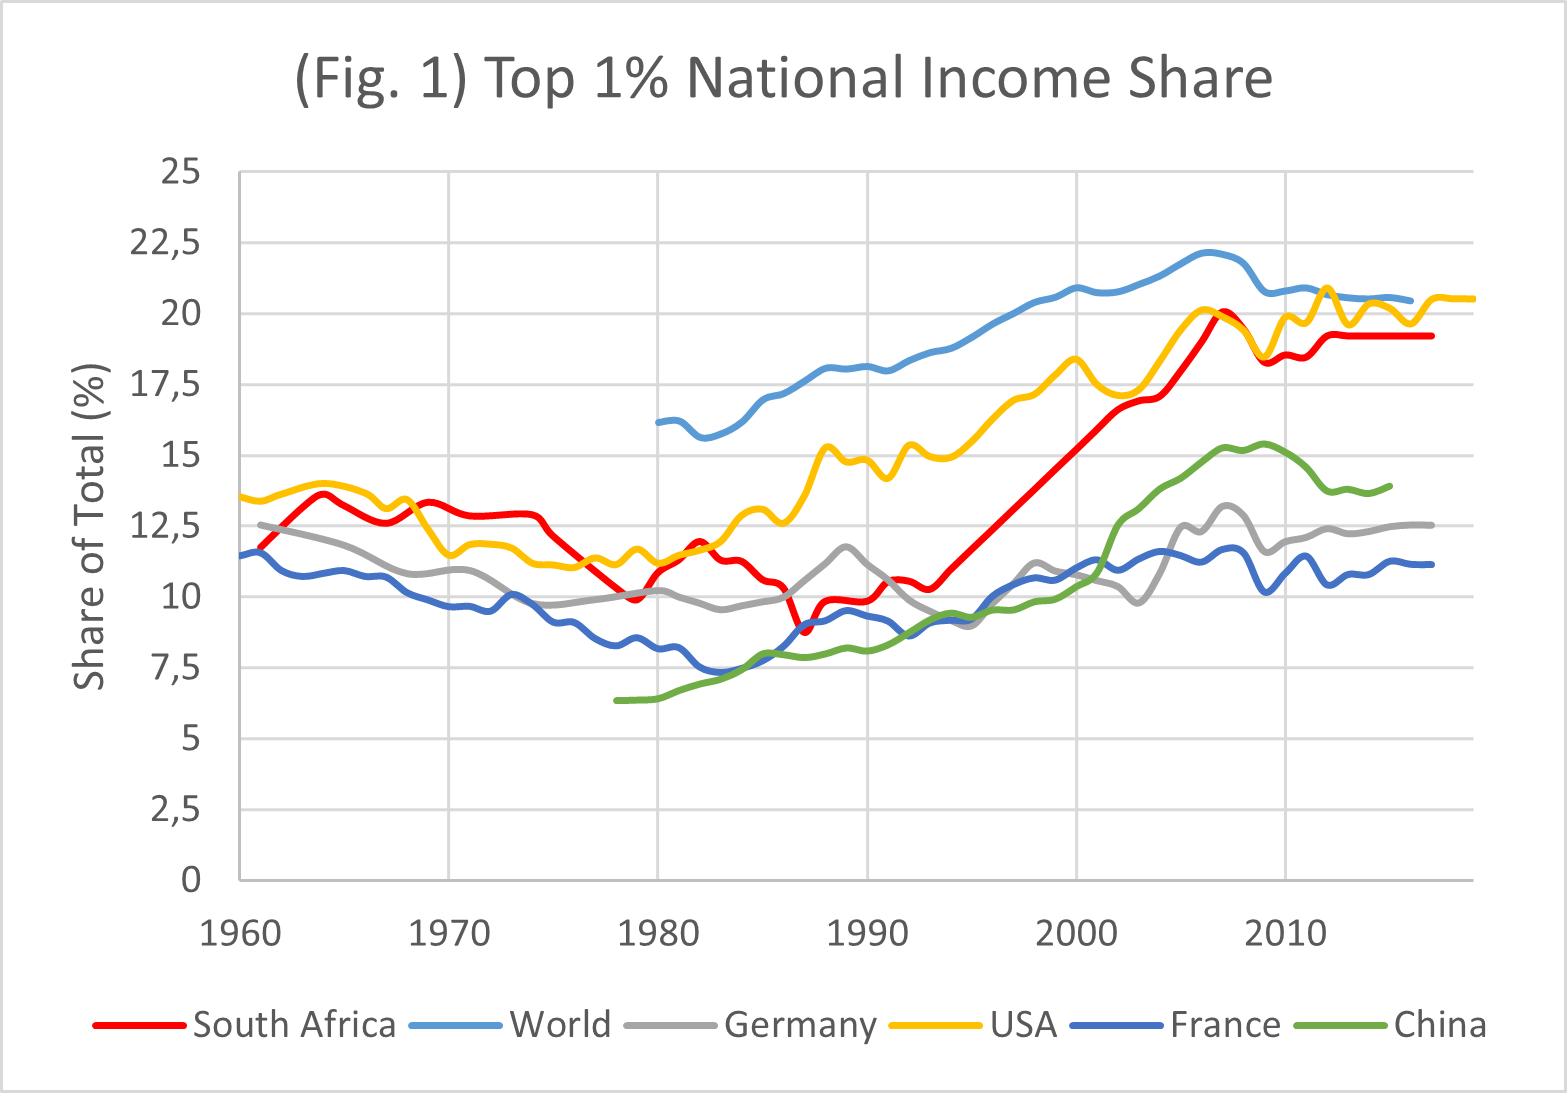
Data: World Inequality Database
Observing trends in the top 10%’s income share, the lop-sided nature of South African income distribution becomes even more apparent. According to the WID baseline estimates, the top 10%’s share of income in South Africa has been, over the past 60 years, consistently 1.5–2x higher than in the industrial economies of Germany, France, China, or the US. Like the 1%’s share, the 10%’s income share in South Africa was also trending downward, in addition to the rest of the world prior to the 1980s, and like the 1%’s share it too spiked in 1994, followed by a massive upward trend that only tapered off in the 2008 recession. Since 2008, the 10%’s income share has continued to rise (spiking post-recession from 2009 to 2013), whereas in other countries, the top 10% have seen only slight upward trends in income share over a similar period. As of 2017, the top 10% in South Africa possessed roughly 65% of all national income. To compare, the top 10% in the US for the same year possessed less than half (46%) of national income, and in Germany and France, only about one-third. Since 2005, South Africa’s top 10% have even exceeded the world average income share for the same percentile. Through these estimates, we arrive at the startling conclusion that 80% of South Africans in 2017 possessed only a mere one-third of the total national income.
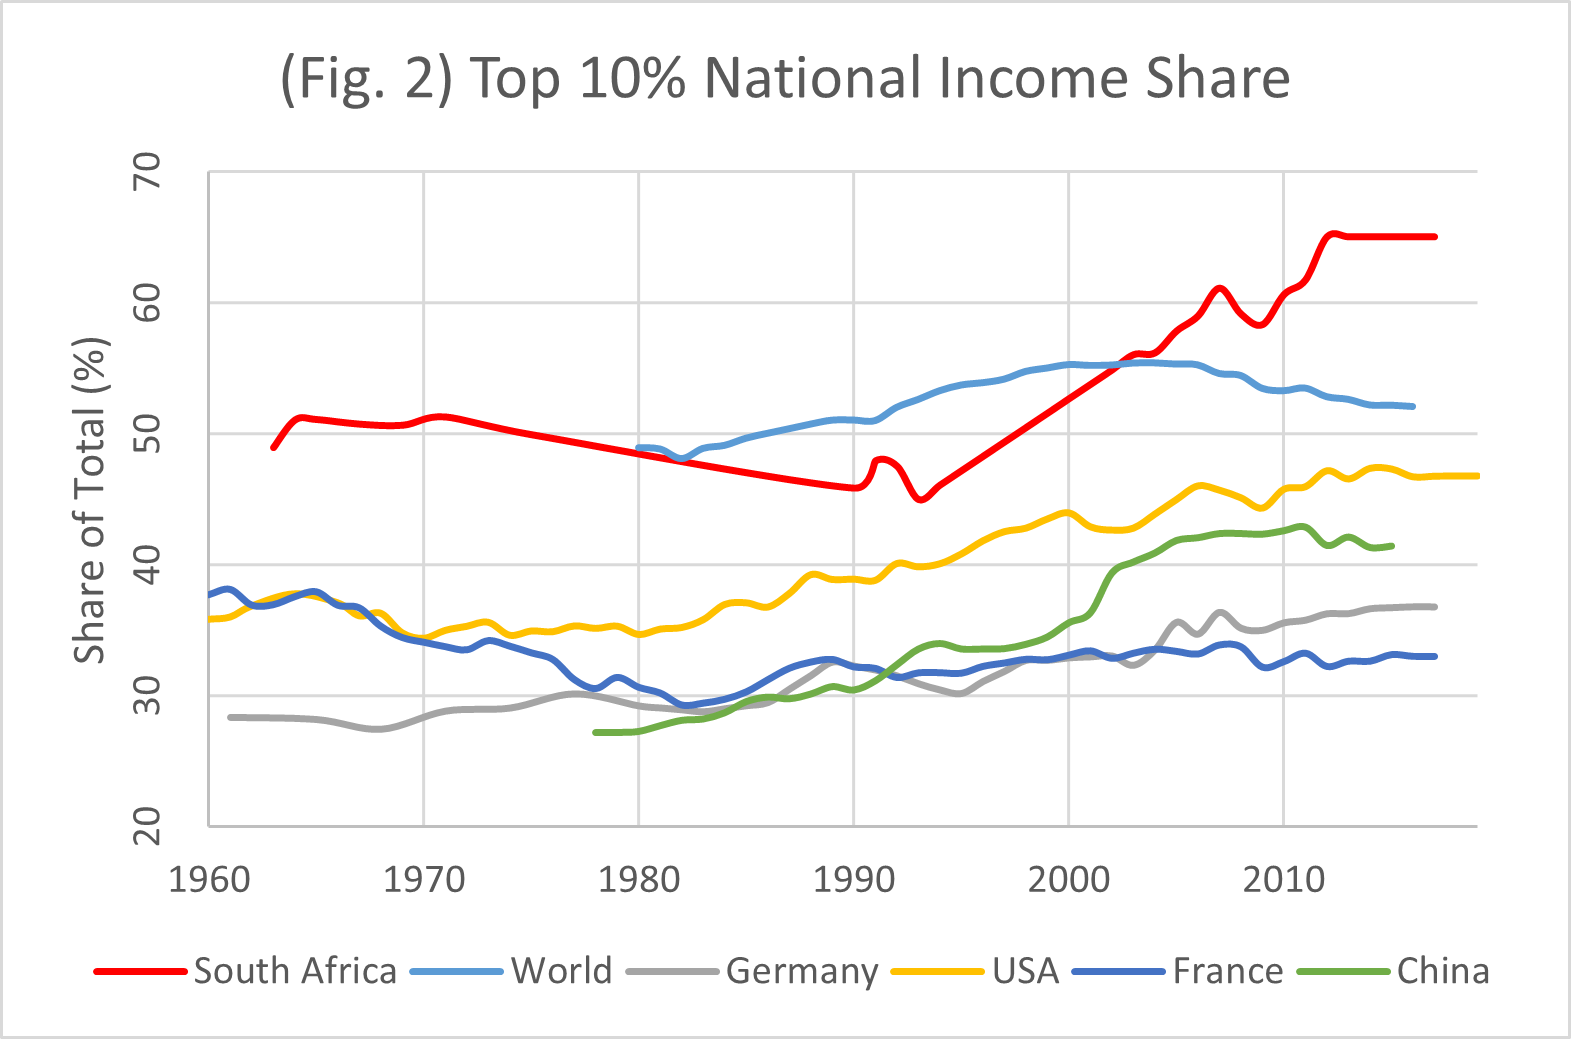
Data: World Inequality Database
Data: World Inequality Database
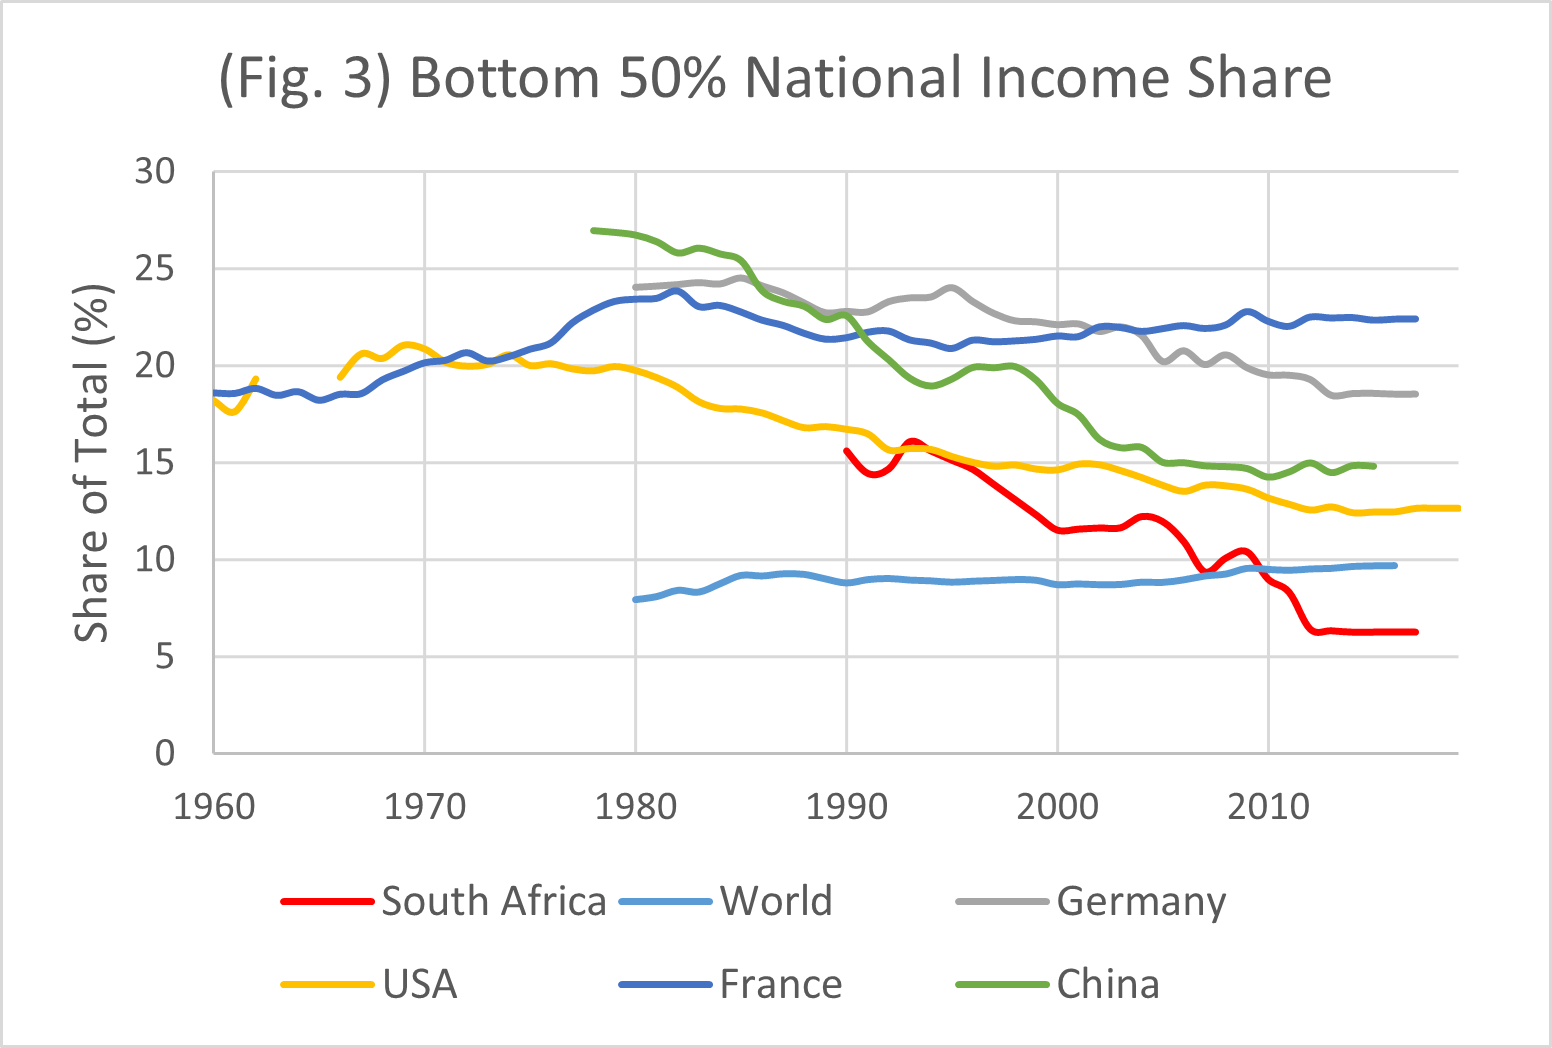
Regarding the bottom 50% (Fig. 3), the WID has rather limited data, with Alvaredo’s household survey estimates for South Africa beginning in 1991. The general trend for the bottom 50% in South Africa appears to be a near inverse of the upward trend in Figure 2 for the top 10%: as the total income share for the upper-middle class (top 10%) grew, the income share for the bottom half fell over the same period. In 1990, the pre-apartheid income share for the bottom 50% was an estimated 15.6% of total national income, but by 2012 that share had sunk to 6.5%.
With the official end of apartheid in 1994 and the reintegration and re-enfranchisement of millions of Black South Africans, one might logically expect economic inequality to decrease post-1994. However, Alvaredo’s estimates for income distribution seem to rebuke that logic. One might also argue that South African data should be considered in light of general global trends that reveal that the top 10%’s and 1%’s income shares were already increasing by the 1980s and 1990s, and that the bottom 50%’s income shares were decreasing, but for South Africa, these trends have been more extreme than in the other observed countries. One potential explanation for South Africa’s rapid statistical jump in income inequality post-1994 is the re-enfranchisement of Black Africans and their sudden inclusion in South African national accounting, but also the uneven rise of a Black middle class. For the colonial period and throughout apartheid, Alvaredo’s tax estimates completely missed the Black/Colored population living in South Africa, as the vast majority were not granted full citizenship until 1994 and were simply too poor to qualify for taxes. In 1994, a restructuring of South African tax codes and racial laws, plus the distribution of household surveys, meant that, for the first time, Black income data were included in a significant way. From a statistical perspective, including low-income, Black African data has the potential to push income distributions further toward the upper register by simply increasing the population denominator at the lower register. Such inequalities once went undetected by the data, but through a change in the data collection itself, were exposed. On the other hand, post-1994 regime policies intended to restructure society and heal centuries-long racial wounds led to sporadic mobility for some Black Africans into the middle and upper classes while the majority remained entrenched in apartheid-era systems. The entry of some Black Africans into the upper classes throughout the 1990s and 2000s may have also played a role in this dramatic shift in income distributions toward the upper percentiles.
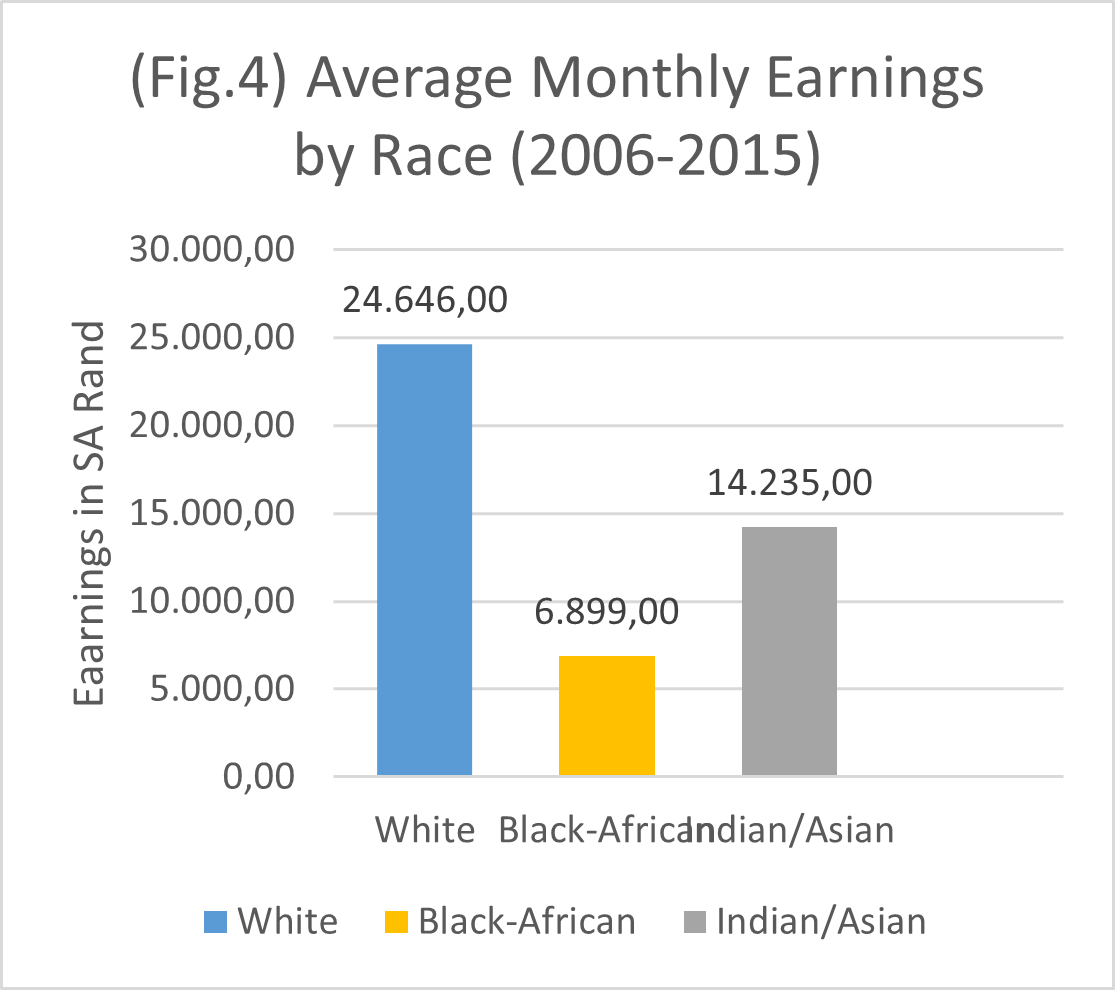
Average monthly earnings in Rand according to race between 2006-2015. Data: SAStats
Being a highly multicultural and multiethnic society, it would be helpful to obtain a glimpse at inter- and intra-racial economic inequality, particularly since apartheid (this cannot be gathered from Alvaredo’s data series). Therefore, to study racial income distribution in post-apartheid South Africa, I examined average monthly income data from the South African Department of Statistics for 2006–2015. While history has told us apartheid ended in 1994, earnings data some 20 years later seem to tell a different story, or at least the old familiar story. Between 2006 and 2015, Black South Africans earned three times less than their White countrymen and two times less then more recent Indian and Asian immigrants8.
Key Indicators: Wealth Inequality
Regarding wealth inequality, I once again consider estimates from the South African Department of Statistics online database, as well as the current baseline data from the WID for South Africa, France, China, and the US (there are no current data series for wealth estimates in Germany in the WID). Since wealth data estimates are not available for South Africa until 1993, my period of interest for wealth inequality focuses exclusively on the post-apartheid period from 1993–94 to 2018. I plotted wealth-distribution trends for the mentioned countries over the period of interest (some stretching back to 1960 when data were available) for the 1st, 10th, and bottom 50th percentiles. One would expect that any increase in democratization or socio-political equality in a country would translate into some type of positive effect on economic equality and a more egalitarian distribution of wealth. However, wealth data, much like income data, seem to suggest the opposite is true for South Africa since apartheid.
The most up-to-date wealth data series provided in the WID comes from Chatterjee et al. (2020), examines the period 1993–2018, and models its empirical approach after the work of French economist Thomas Piketty. South Africa, at no point since 1993, has had a comprehensive wealth tax, nor are there any official metrics for measuring individual or household financial assets (bonds, equities, life insurance funds, pensions). Lacking such highly organized micro-administrative data, Chatterjee et al.’s estimates for South Africa are perhaps not as precise as Piketty’s for France or the US. Instead, the authors rely heavily on household survey data, estate duty taxes, and extrapolating income tax data (a strategy first undertaken by Orthofer [2016], which Chatterjee et al. build upon) to estimate South African wealth distributions.9 While surveys might prove particularly useful in a country such as South Africa, where much of the population does not pay taxes and live in informal settlements, they come with several drawbacks. One drawback is that household surveys are usually voluntary, and wealthier households are less likely to reveal their net worth. However, such underrepresentation is unlikely to bias long-term trend estimates since such behavior should remain constant over time. Furthermore, it is actually quite difficult for most people to calculate or know the net value of their own wealth, leading to a potentially large margin of error. Data estimates for China (Piketty, Yang, & Zucman, 2016), France (Garbinty & Piketty, 2020), and the US (Piketty, Saez, & Zucman, 2016) were gathered from empirical studies currently being used by the WID10.
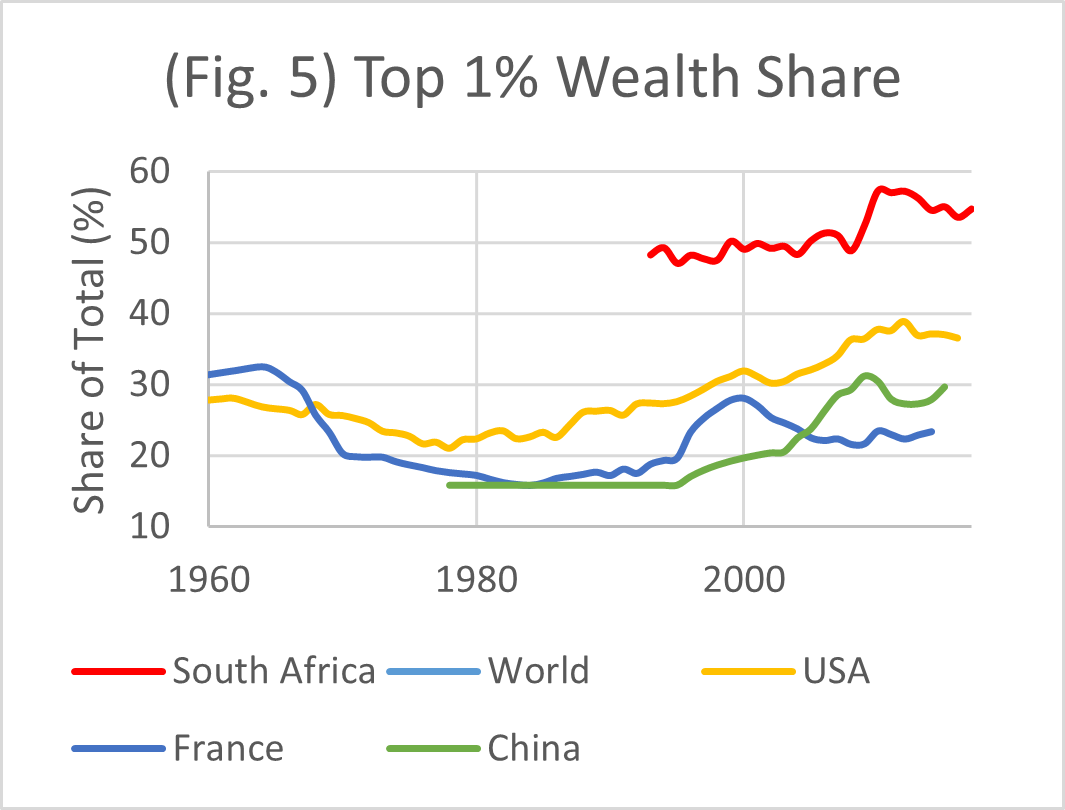
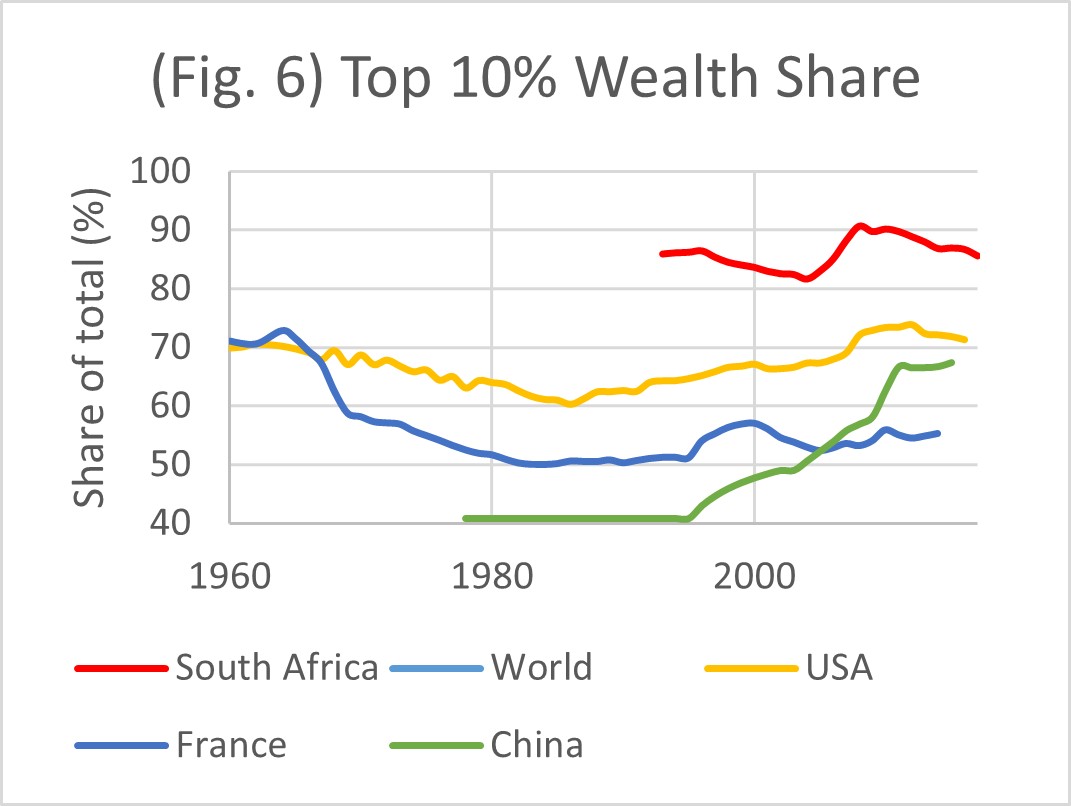
In Figures 5 and 6, Chatterjee’s estimates reveal an extraordinarily disproportional wealth distribution in the top percentiles in South Africa since 1994. While having followed a general, upward global trend since 1994, the 1%’s share of wealth has been nearly twice as large in South Africa than in the large industrialized economies of China, France, and the US.
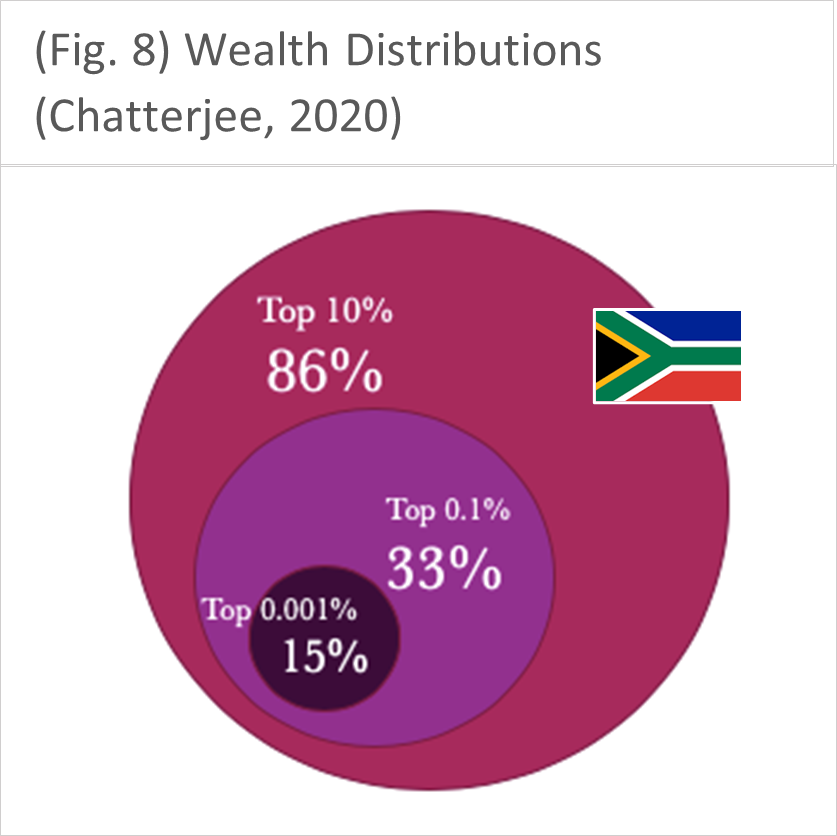
At the time of Mandela’s rise to power in 1994, 1% of South Africans owned nearly 50% of all the country’s wealth. By 2001, this figure had grown to 60% before beginning to trend downward for the first time since the end of apartheid. The unequal distribution of wealth in South Africa is even more extraordinary at the 10th percentile: 10% of South Africans owned 86.1% of wealth in 1994, 90% in 2010, and again 86% in 2017. However, in the 10-year period that immediately followed apartheid (1994–2004), the top 10%’s share had substantially and gradually shrunk (roughly 5%). This could be evidence of gradual wealth redistribution as a result of post-apartheid policies and their negative effects on the upper-middle class, or, rather, their positive effects on the remaining 80% of the population. The re-enfranchisement of Black and Colored South Africans post-1994 meant that, for perhaps the first time in South African history, these people had legal claim to purchase and own property in non-Bantustan territories. The abolition of legal barriers to home ownership, in addition to large-scale government building programs, could imply a redistribution in the wealth data toward the middle or bottom.
Chatterjee (2020)
Chatterjee (2020)
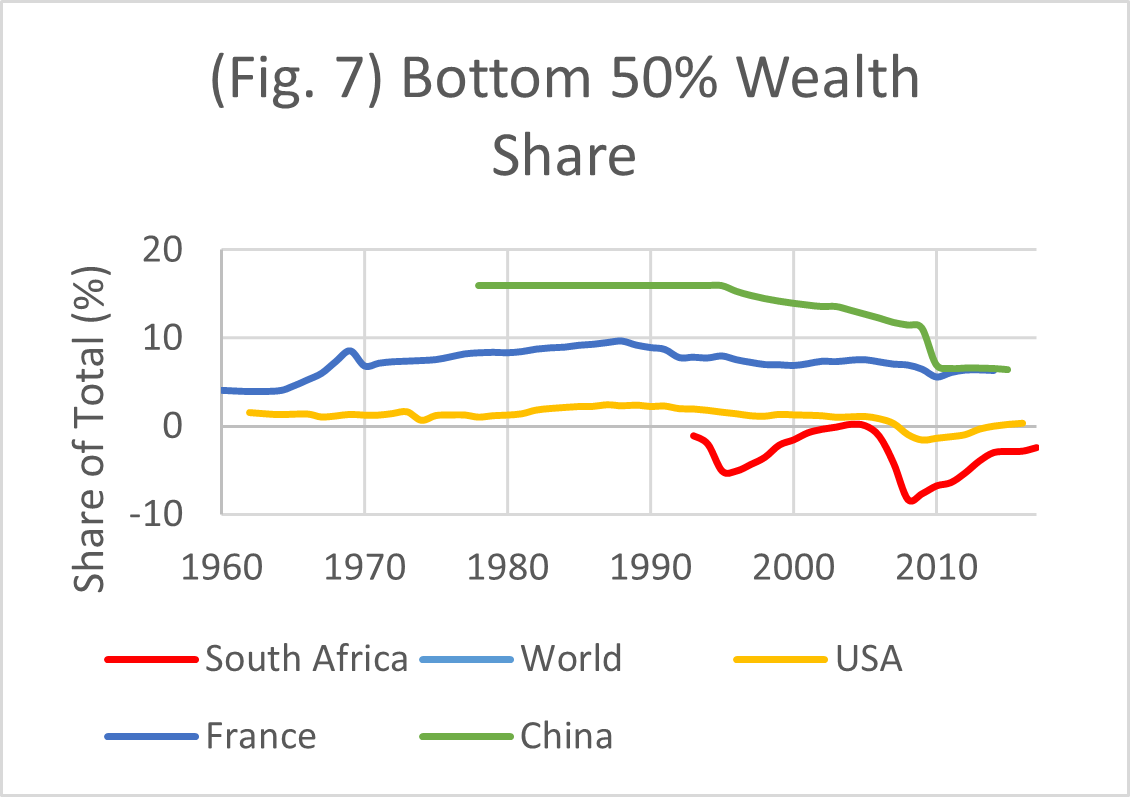
Such possible explanations for wealth-share trends post-1994 are also supported in Chatterjee’s wealth estimates for the bottom 50%. Figure 7 illustrates that between 1995–95 and 2004–05, the bottom 50%’s share of wealth increased by roughly 6%, from (-)5.2% to (+)1% of total wealth owned. An increase in the share of wealth owned by the bottom may also imply increases in home ownership. However, wealth shares for the bottom 50% have collapsed drastically since 2007–08 and remain deeply negative – the bottom 50% of South Africans owe more in debt than they own in wealth assets. Furthermore, Chatterjee’s estimates seem to highlight the devastating effect of the Great Recession on the bottom half of South African society, while over the same period, the 1st and 10th percentiles saw their wealth shares increase. Wealth shares at the 50th percentile are typically low in most countries. In the US, the share has been hovering around zero for nearly 60 years. Yet the question remains, why has South Africa seen no lasting wealth redistribution following apartheid? As of 2017, South Africa’s top 0.1% owned one-third of all wealth, and the top 0.001%, about one-sixth 11. The Chatterjee/WID estimates imply that inequality trends have largely persisted, and in some cases worsened, whereas trends toward more egalitarian wealth distributions were miniscule and short lived.
Chatterjee (2020)
Chatterjee (2020)
As with with income distributions, wealth distributions over the entire population might tell us about inequalities between economic classes (i.e. the very rich, the middle class, low income). However, they do not tell us very much about the character or demographic makeup of those disparate economics groups in a given population. Therefore, it is helpful to analyze some indicators on how inter-racial wealth inequality has developed in the post-apartheid period. The South African Department of Statistics’ online database provides some useful metrics for analyzing the racial makeup of South African inequality. For the years 2009, 2011, and 2015, the database calculated “average asset scores” and also within-race group Gini coefficient estimates for the classical South African demographic categories, “Black African,” “White,” “Colored,” and “Indian/Asian.” According to a Dept. of Statistics’ 2019 report on inequality, the “average asset score” is a measure of household wealth via a set of 18, internally selected assets.12 A household’s “score” is calculated by simply counting how many of these 18 assets the household owns in a given year. Although the identities of all 18 assets are not explicitly stated in the report, some include flushing toilets, internet service, and homes/property. As I mentioned previously, the absence of a wealth tax in South Africa poses significant challenges when measuring total wealth owned. The SA Dept. of Statistics attempts to overcome this lack of micro-data with household surveys and its simple asset score strategy, but one should be mindful that detailed micro-level data on wealth and voluntary asset ownership surveys do not have the same explanatory power, nor the same accuracy. Nevertheless, average asset score measurements can offer us a helpful glimpse into the demographic breakdown of macro-wealth-distribution trends in South Africa.
Figure 9 reveals that some form of racial stratification in South African society seems to persist – at least regarding asset ownership. Black Africans continue to be severely disadvantaged in terms of asset ownership when compared with White South Africans in the decades following apartheid: an average of 7.6/18 compared with 14.8/18 in 2009; 8.7/18 compared with 15.5/18 in 2011; and 9/18 compared with 14.7/18 in 2015. While Black African asset scores increased over this short period, they are dwarfed by the scores of White South Africans. “Colored” South Africans (mixed-race) have fared somewhat better, and Indian/Asians significantly better than their Black countrymen. Interestingly, such stratification of asset ownership along racial lines directly reflects the social stratification of racial groups during the apartheid era.
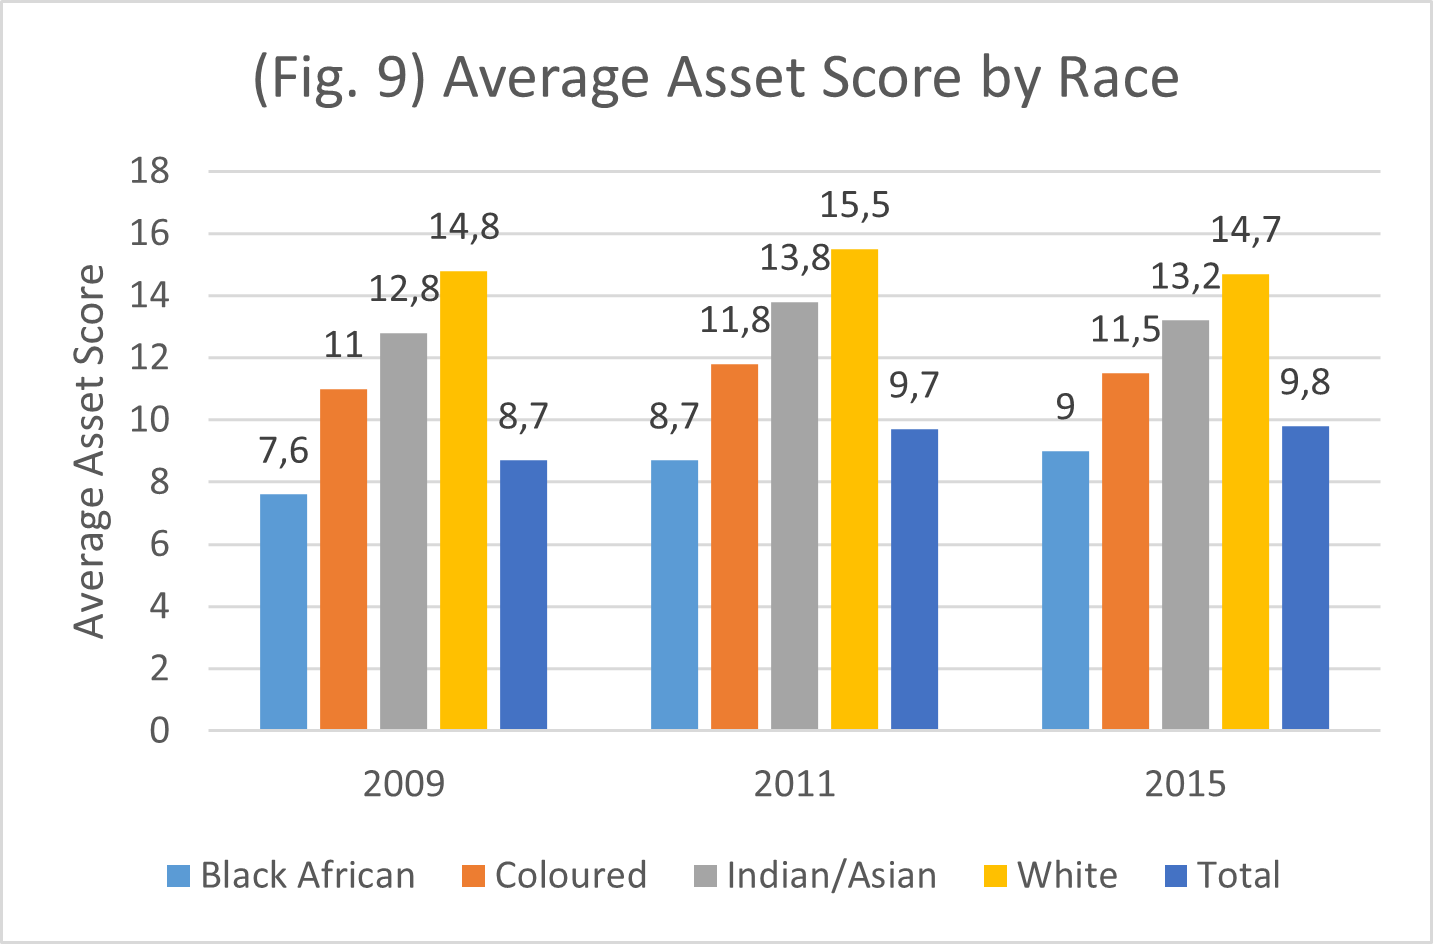
Report-03-10-19, SA Stats.
Under the National Party’s rule, Whites received the highest status, followed by Asians, Coloreds, and Black Africans. Reforms during the apartheid era even granted some parliamentary representation and greater property rights to Asians and Coloreds, but not to Blacks.13
Chatterjee (2020)
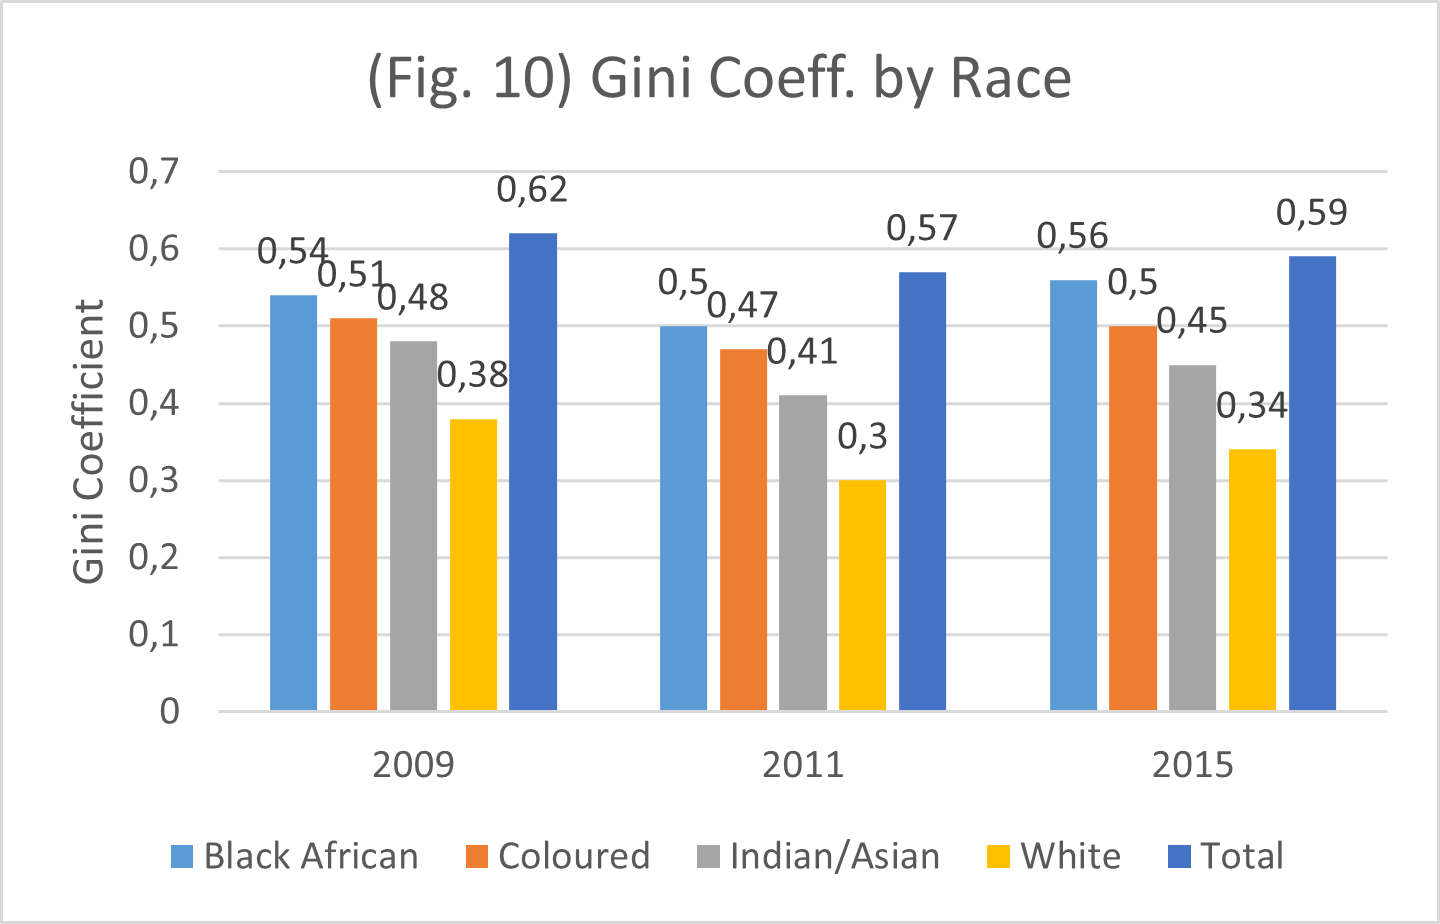
Have post-apartheid economic trends been evenly felt within previously disadvantaged demographic groups? Orthofer’s (2016) research highlights that while inter-racial inequalities persist, intra-racial inequalities have worsened in the time since apartheid, noting the rise of the Black African middle- and even millionaire-class 15. As mentioned previously, the enfranchisement of Black citizens and the expansion of work and housing opportunities throughout the 1990s resulted in the rise of a Black middle class in South Africa. Furthermore, since 2007, the number of Black millionaires in South Africa has nearly tripled – as of 2015, 45% of all millionaires in South Africa were Black. However, such figures can be deceptive. While some in the Black community have reached previously unattainable levels of success and wealth since the end of apartheid, for many Black Africans, the notion of “equal opportunity” is a farce. To obtain a closer look at intra-racial wealth inequalities (inequalities within racial groups), Figure 10 displays the Gini coefficient for each of the four racial groups for the same years as in Figure 9. Gini coefficients for racial groups signify the within-group distribution of wealth, with a value of 0 meaning perfectly egalitarian, and a value of 1 meaning maximum inequality. What we find is that between the 2009 and 2015, wealth inequality within the Black African demographic group (the previously most-disadvantaged race classification) was noticeably higher than “Coloreds” and “Indians/Asians,” and nearly double the Gini coefficient for “Whites.” Furthermore, for each year, the inequality within the Black African community is nearly as large as the total inequality between all other groups (represented by “Total”). Although Figure 9 implies that wealth inequality across racial lines has, to an extent, persisted since apartheid, Figure 10 suggests that the worst wealth inequality in the past decade actually occurs within the Black African group itself. The expansion of political and legal rights for Black Africans post-1994 has translated into the expansion of economic opportunity within that community. However, the high within-group Gini coefficient for Black Africans reveals a paradox underlying the notion of “equality of opportunity” for previously disenfranchised groups in modern South Africa and in many other democratic, capitalist societies: equality of opportunity does not always translate to less economic inequality; it can create more of it. Black success stories do not change the fact that much of the Black community is trapped within apartheid-era socioeconomic structures. Instead, such stories drive the inequality statistics to even greater extremes.
Such inter-racial disparities in average asset score in the 2000s and 2010s reflect a possible persistence in apartheid-era racial stratification in South African society. Legally, this is no longer true, but since wealth is often accumulated and transferred over longer periods of time, it could likely mean that a more egalitarian redistribution of wealth toward previously disadvantaged groups is simply lagging behind real changes in social policy or shifts in incomes. Some in the South African financial sector agree, citing in a 2016 BuissnessTech article that the process has simply been “too slow.”14
Spatial Inequality: Neighborhoods and Housing
The final indicators of wealth and income inequality I analyze consist of locational (housing, geography, infrastructure) data series, estimates, and some images gathered from various sources, including magazine articles and real estate websites. I believe that the geographical scars of apartheid and the persistence of racialized, spatial divisions within South African society are highly relevant for understanding race as a determinant of wealth and income inequality in South Africa. I specifically examine Johannesburg and its suburbs, including neighborhoods photographed in “Unequal Scenes” (from Section 2, Main Theme). Ideally, I would examine several South African cities and their suburbs, but given the research constraints, I treat Johannesburg as being exemplary of all South African metropoles. That said, Johannesburg may be slightly biased toward greater levels of inequality since it is the wealthiest and economically most important city in South Africa and since its northern location makes it closer than some other cities to former Bantustans (African homelands).
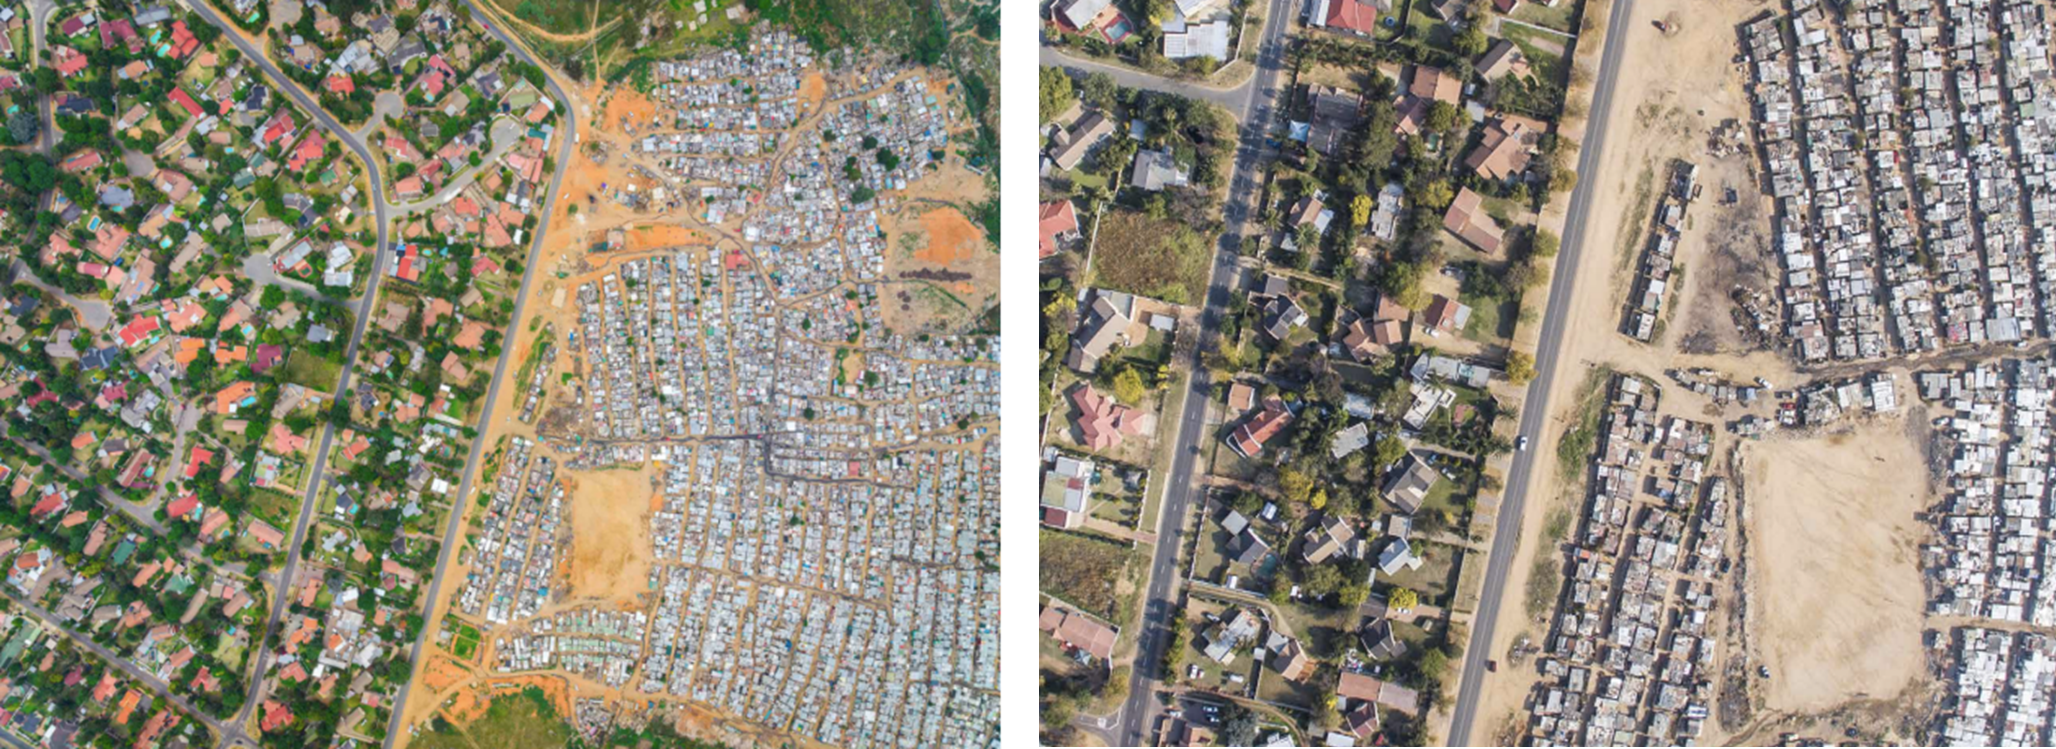
Image 1.6 (left) Aerial photo of Primrose and Makause. Image 1.7 (right) Same location but enlarged. Source: Johnny Miller/ Unequal Scenes
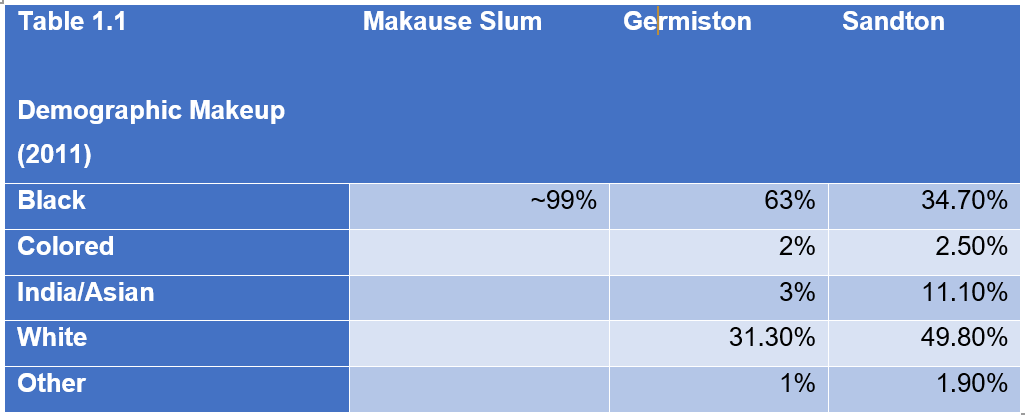
The images above, taken from photographer Johnny Miller’s collection “Unequal Scenes,” expose inequality in Johannesburg’s eastern suburbs from the air. Both images show the middle-class neighborhood, Primrose, on the left side, and the informal township, Makause, on the right. Both located within the suburb of Germiston, Primrose is an officially recognized (“on the grid”, so-to-speak), developed area with paved roads, garbage collection, large gardens and green spaces, private automobiles, private swimming pools, and fitness clubs. Makause is an unrecognized (“off the grid”), informal settlement, formed decades ago by Black, internal migrant workers and comprising sheet-metal shacks and other makeshift homes. While Germiston had a rather racially diverse population in 2011 (see Table 1.1), in Makause the population is entirely Black Africans and Colored peoples who lack basic city services such as plumbing or paved roads. Work opportunities for township residents like those in Makause are often far away in city centers, and without reliable public transportation connections, the journey is usually long and expensive (private omnibuses can cost nearly half a day’s wage for a service-sector worker). The two settlements are separated only by a large main road that cuts through the landscape like a knife, separating Makause’s poverty and the suburban comfort of Primrose with precision. Large electric fences and gates surrounding Primrose properties, once built to separate race groups, continue to ensure that the two worlds must remain divided. Such scenes are not exclusive to Johannesburg’s eastern suburbs either: an estimated three million South Africans were living informally as of 2011, and informal townships similar to Makause can be found along the outer perimeters of every South African city17.
Baker (2019)
Baker (2019)
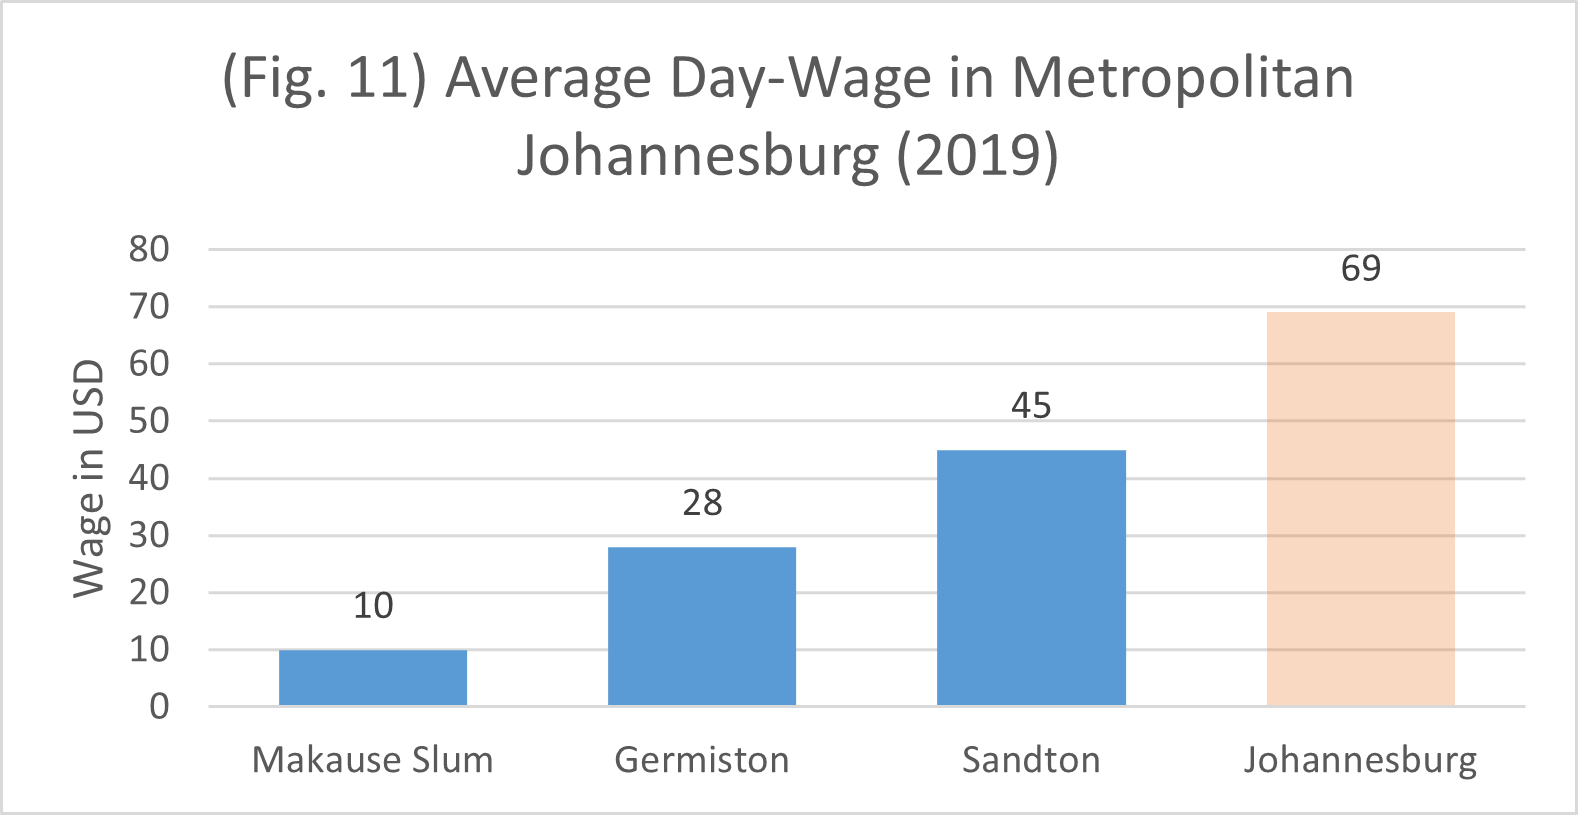
Regarding the Makause township, the middle-class town of Germiston, and the wealthy, nearby town of Sandton, I compared demographic and wage data to make some assumptions about spatial inequality in the eastern suburbs of Johannesburg (Table 1.1 and Figure 11). I calculated the average daily wage for Germiston, Sandton, and Johannesburg by converting the average annual salaries from rand to USD for each location, then divided that by 365 days. For the Makause township, my estimate is based on an estimate in TIME magazine since there are no official earnings statistics for unofficial, unincorporated areas. 18In Johannesburg, the average daily wage in 2019 was nearly 70 USD. Johannesburg is the economic heart of South Africa, and wages are higher there than anywhere else in the country. Looking at Figure 11, the average day wage earned by Germiston residents (which includes Primrose) is three times greater than the estimate for a service-sector worker living in Makause township; in Sandton, the average day wage is four to five times greater; and in Johannesburg, day wages are, on average, seven times greater (although Johannesburg should be considered an outlier since a large metropolitan city will simply offer higher paying jobs). 19Furthermore, while Sandton and Germiston are roughly equidistant from downtown Johannesburg, Sandton is markedly the more White and affluent of the two.20Although many factors affect earnings differences in each suburb, I want to highlight that in suburban east-Johannesburg, residential location appears still highly stratified along racial lines and geography, a significant determinant of income: impoverished, informal settlements are overwhelmingly inhabited by Black Africans and Colored peoples, middle- and working-class suburbs are more mixed, and upper-/ upper-middle-class suburbs are disproportionately inhabited by the minority Whites and Asians.
Data: Property24.com
Data: Property24.com
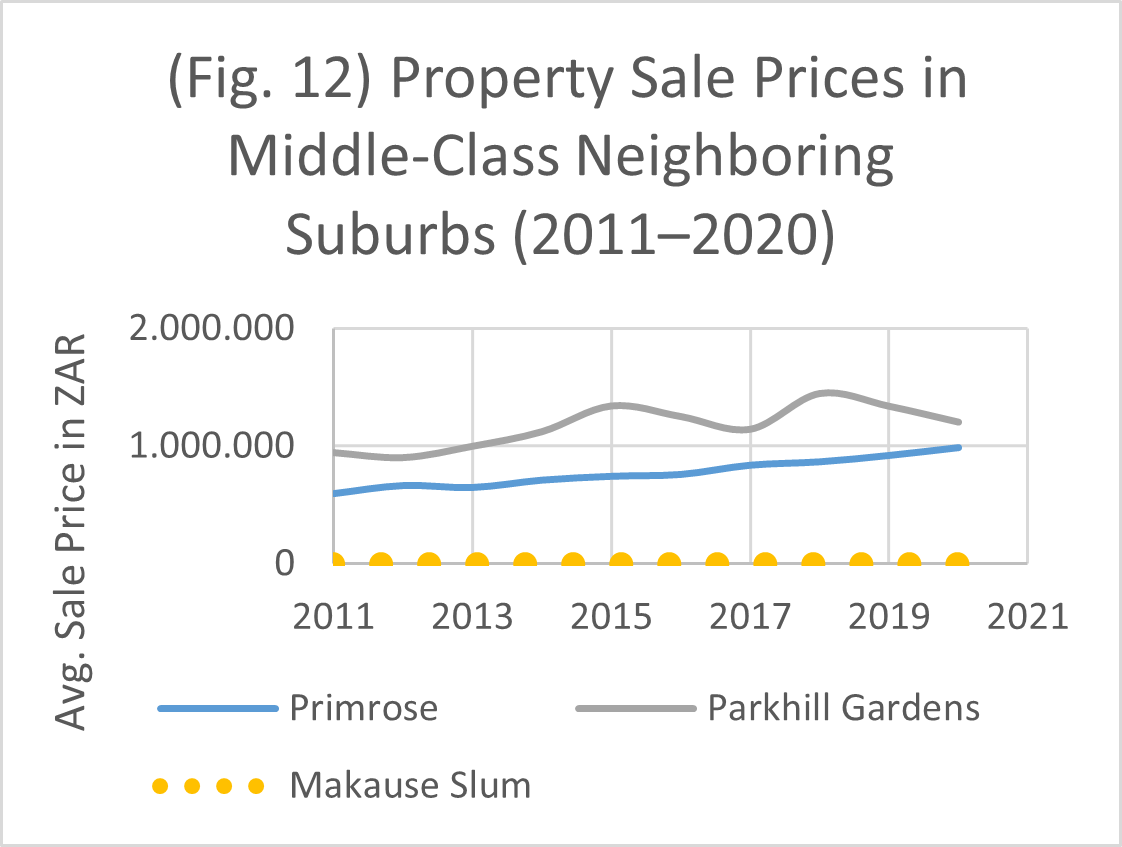
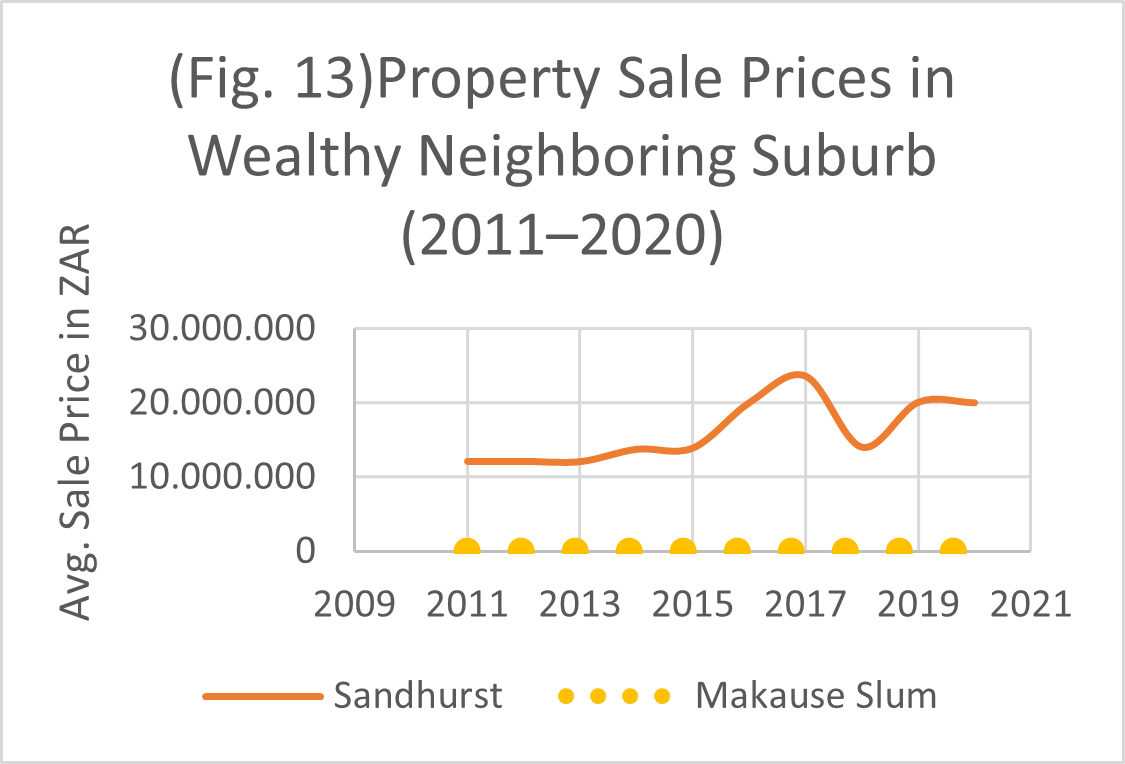
If residential location and racial makeup play significant roles in South African incomes, then this must imply something about how and where wealth is divided. For most upper-middle, middle- and working-class South Africans, one of the largest assets and sources of wealth one can own is property (or a home). For the vast majority of Black and Colored peoples living in informal townships, any property claim is invalid and unrecognized by the government – often, the settlements are on government or farmers’ properties, leading to constant conflict over “who owns the land.” Real estate/property price estimates do not exist for places like Makause, and the makeshift structures in which people live have no tangible value as assets. Howeververy near Makause, in the formal neighborhoods of Primrose or Parkhill Gardens, property sale prices have averaged between 600k and one million South African Rand (or 50–60,000 USD) over the past 10 years. In nearby Sandhurst, there are several ultra-rich neighborhoods, with property sale prices ranging between 10 and 20 million rand (one million USD).21 In the years following 1994, and until 2004, Mandela and his ANC government abandoned the notion of redevelopment (literally reshaping apartheid geographies); instead, they promoted a policy of rapidly improving the living conditions for Black Africans and Colored citizens. This involved upgrading existing housing in informal areas rather than relocating township-dwellers into incorporated ones.22 Today, while suburbanites can claim thousands or millions of rands’ worth of property as assets or personal wealth, housing in informal areas has no inherent value, and the residents have no financial assets to pass on to their families. These informal settlements even continue to grow as migrants from elsewhere in Africa are lured in by the cheap cost of living. However, these townships are largely the product of a bygone, segregationist era and continue to divide modern South Africans physically, barring the disproportionately Black township residents from formal infrastructures and the opportunities for wealth accumulation their neighbors across the street enjoy.
Conclusion
Inequality research on South Africa is still a relatively new field and has been heavily influenced by the recent works of Thomas Piketty. Moreover, South Africa is currently one of only seven nations for which there is available wealth-inequality data in the WID. In this study, I examined only a few mainstream sources, as well as some unconventional ones, to provide an overview of wealth and income inequality in the country. I found that race and the spatial/geographical divisions persisting since apartheid-era racial policy continue to be key determinants in explaining the extreme nature of South African inequality. Despite the appeal South African inequality might have to researchers, there are several practical and historically rooted factors that make estimating historical wealth and income data for South Africa challenging – some of which I discussed. Pre-1994 historical estimates tell us very little about disenfranchised racial groups under colonial and apartheid regimes. Similarly, the post-apartheid period is still perhaps too young to make any absolute conclusions about the economic successes or failures of Mandela’s ANC government.
In retrospect, my analysis might have benefited from including better, or more similar, comparison countries when examining wealth and income-inequality trends. South Africa’s economy under the apartheid regime was likely very different than that of the US, France, Germany, or China over the same period. More important, the South African economy since the end of apartheid in 1994 has been largely considered a “developing” one, whereas the other comparison countries have long been firmly established as advanced industrial economies. One might expect that, if compared with other developing economies, the inequality levels in South Africa since 1994 may not seem so unusual. However, currently, there is only historical wealth-distribution estimates for seven nations, according to the WID, among which South Africa seems to be exceptional. It is perhaps simply the lens with which we compare South African inequality to other countries’ inequality that makes it seem so extreme. Nevertheless, the available research and data on South Africa reveal enough evidence to support the idea that the economic legacy of apartheid has persisted in many ways, and that the country remains highly unequal.
References
- Alvaredo, Facundo and Atkinson, Anthony B. (2011). Colonial Rule, Apartheid and Natural Resources: Top Incomes in South Africa 1903-2007. CEPR Discussion Paper 8155.
- Baker, A. (2019, May 02). What South Africa Can Teach Us as Worldwide Inequality Grows. Retrieved August 1, 2020, from https://time.com/longform/south-africa-unequal-country/?utm_source=facebook.com
- Census Bureau at South African Dept. of Stats - http://www.statssa.gov.za/?page_id=1417
- Chatterjee, Czajka and Gethin (2020). Estimating the Distribution of Household Wealth in South Africa.
- Garbinti, Goupille-Lebret and Piketty (2020), Accounting for Wealth Inequality Dynamics: Methods, Estimates and Simulations for France (1800-2014), Journal of the European Economic Association.
- Orthofer A. (2015), “Private Wealth in a Developing Country. A South African Perspective on Piketty”, ERSA Working Paper 564
- Ottoway, Marina (1993). South Africa: The Struggle for a New Order. Washington: Brookings Institution Press. pp. 23–26. ISBN 978-0815767152.
- Piketty, Thomas; Saez, Emmanuel and Zucman, Gabriel (2016). Distributional National Accounts: Methods and Estimates for the United States.
- Piketty, Thomas; Saez, Emmanuel and Zucman, Gabriel (2016). Distributional National Accounts: Methods and Estimates for the United States.
- Piketty, Thomas; Yang, Li and Zucman, Gabriel (2016). Capital Accumulation, Private Property and Rising Inequality in China, 1978-2015; Garbinti, Goupille-Lebret and Piketty (2018), Income inequality in France, 1900-2014: Evidence from Distributional National Accounts (DINA), Journal of Public Economics; Bartels, C. “Top incomes in Germany, 1871-2013,” WID.world Working Paper 2017/18;
- Piketty, Thomas; Yang, Li and Zucman, Gabriel (2016). Capital Accumulation, Private Property and Rising Inequality in China, 1978-2015.
- Property/Housing Sale Values - https://www.property24.com/
- Property24 website: https://www.property24.com/
- Regional Salary Estimates – https://www.payscale.com/
- “Report-03-10-19 - Inequality Trends in South Africa: A Multidimensional Diagnostic of Inequality” (2017), SASTATS
- “Report-03-10-19 - Inequality Trends in South Africa: A Multidimensional Diagnostic of Inequality” (2017), South African Department of Statistics.
- South African Department of Statistics - http://www.statssa.gov.za/?page_id=593
- World Inequality Database https://wid.world/data/

Joshua Whitcomb
MA History & Economics Student